Home@ix FAIR-Index — A Forward Indicator of UK Housing Affordability Regimes
Known issues (pre-publication)
- Animation rendering: some animated assets may not display in all viewers. Use exported GIF/PNG fallbacks in
assets/where provided. - Math rendering: equations are standardised to
$$...$$. If any equations appear unrendered, open the HTML in a modern browser (MathJax-enabled).
Chapter 1 — Introduction: The Regime Behind the Crisis
The UK housing affordability crisis is routinely described as a shortage story. Not enough homes. Not enough land released. Not enough planning permissions granted. That framing is not wrong — but it is radically incomplete. And its incompleteness has policy consequences: it directs attention toward symptoms while the structural engine of exclusion runs largely unexamined.
This book argues that the dominant driver of accelerating homeownership exclusion in the UK is not a physical supply gap alone. It is a financial regime failure — one shaped by the concentration of bank credit in residential mortgage lending, the macroprudential architecture of post-crisis banking regulation (Basel III), and the resulting feedback loops that make housing markets clear through rationing and exclusion rather than through orderly repricing and widening access.
Part One: Financialisation as a Structural Condition
The UK banking sector allocates an unusually high share of private-sector lending to residential mortgages — a structural feature that links housing-market cycles directly to bank balance-sheet health, deposit creation, and broad money dynamics. In an endogenous money system, mortgage lending creates deposits: when mortgage origination weakens, broad money growth can undershoot nominal activity trends, tightening conditions economy-wide. When it surges, it inflates collateral values, reinforcing the next cycle of lending against the same asset base.
This is not a market functioning normally under price signals. It is a financialised circuit in which housing serves simultaneously as necessity, collateral, and speculative asset — and in which the interests of existing asset-holders are structurally privileged over the access needs of would-be entrants. The consequence is not merely high prices. It is a market that, under stress, stops clearing for a large share of the population entirely.
Part Two: Basel III and the Macroprudential Transmission
The post-Global Financial Crisis regulatory settlement — crystallised in the Basel III framework and its successive implementations — was designed to make banks safer. In important respects, it has. Capital buffers are larger. Loss-absorbency requirements are more stringent. Underwriting standards have tightened.
But the framework is, by design and by the admission of its critics, almost exclusively microprudential: focused on the solvency of individual institutions rather than the systemic allocation of credit across the economy. It does not directly constrain the composition of bank lending portfolios — the structural overweight in residential mortgages that makes the financial system so sensitive to housing-market shocks. And when tighter capital requirements and more conservative underwriting are applied to a system already dominated by mortgage credit, the transmission is asymmetric: it falls hardest on the marginal borrower.
The marginal borrower in the UK housing market is, overwhelmingly, the first-time buyer: younger, lower-equity, more dependent on high loan-to-value products, and most exposed to the deposit and income-multiple constraints that tighten when underwriting standards rise. Basel III's capital surcharges, countercyclical buffers, and stress-testing regimes are not designed to exclude this cohort. But in a financialised housing system, that is their operational effect. Regulatory prudence and structural exclusion become, in practice, the same mechanism.
Part Three: FAIR as the Empirical and Testable Evidence Base
Diagnosis without measurement is assertion. The third and central contribution of this book is the introduction of Home@ix FAIR — a transparent, reproducible, quarterly indicator designed to detect when the UK housing system is shifting into a regime of accelerated affordability deterioration, understood not as a price ratio but as an access-and-allocation outcome.
FAIR is built from two observable precursors to exclusion stress that are directly legible in aggregate data:
- Credit–price decoupling: house-price growth outrunning mortgage-stock growth — the signal that prices are detaching from the credit base that finances them, compressing access for mortgage-dependent buyers.
- Thin-market clearing: turnover declining relative to stock — the signal that the market is rationing participation rather than clearing through price adjustment.
Together, these two mechanisms encode the financialisation and macroprudential transmission story in a form that is quarterly, auditable, and backtestable. When credit tightens under Basel III-era underwriting standards, the wedge between price growth and mortgage-stock growth widens. When the eligible buyer pool narrows, turnover falls. FAIR rises. The regime signal fires — typically 2–3 years before the exclusion effect is visible in conventional affordability statistics.
What FAIR adds to the literature: existing affordability measures are price-centric and contemporaneous. FAIR is regime-centric and forward-looking. It does not ask "are prices high?" It asks: "is the system moving into a state where access is about to deteriorate, and is that deterioration being driven by credit-channel dynamics rather than by fundamental demand?" That is a different — and, this book argues, more policy-relevant — question.
Structure of This Book
The book is organised as a working research bundle. Each section is self-contained but the argument builds sequentially:
- Chapter 1 (this chapter) frames the financial regime failure, the Basel III transmission mechanism, and FAIR as the empirical spine.
- Chapter 2 develops the four interlocking dimensions of crisis — credit impairment, mortgage concentration, M4 money supply dependency, and affordability as allocation failure — and shows how they amplify each other through coupled feedback loops.
- Chapter 3 examines why standard policy responses cannot break the feedback loops, and sets out the structural reform requirements implied by the regime diagnosis.
- Part I and the FAIR Papers that follow provide the foundational market-function exhibits, the formal FAIR derivation, and the full reproducible technical specification.
The figures throughout are generated directly from the Home@ix data pipeline. Every number is traceable to a canonical input. Every chart is regenerable from the accompanying scripts. This is not only a research argument — it is a reproducible evidence base, designed to be stress-tested, extended, and challenged.
Chapter 2 — The Four Dimensions: An Integrated Analysis
The UK housing system is not suffering from a single, tractable problem. It is suffering from four interlocking structural failures that reinforce each other through feedback loops. Analysed separately — as they usually are — each dimension looks manageable. Understood as a coupled system, they describe a regime in which crisis is not a tail risk but a probable trajectory. This chapter develops each dimension in turn before showing how they combine.
- Credit impairment risk in commercial banks under mortgage concentration
- Mortgage lending over-reliance and the collateral feedback loop
- Structural dependency of broad money (M4) on housing credit creation
- Affordability deterioration as an access-and-allocation regime outcome
2.1 Dimension One: Credit Impairment — Surface Stability Masking Structural Fragility
The UK mortgage market presents a paradoxical picture. Headline arrears stood at approximately 0.9% of outstanding mortgages in Q1 2025 — historically low, and apparently healthy relative to pre-GFC peaks of 2–3%. Yet this surface benignancy obscures three significant vulnerabilities.
First, the low arrears rate reflects compositional bias: as mortgage rates declined from their 2022–23 peak, better-quality borrowers re-entered the market while distressed cohorts had already exited or been screened out through stricter underwriting. The observed pool is disproportionately high-quality, understating true vulnerability in the broader stock. Second, the published arrears threshold (2.5% of balance) captures only serious delinquency, missing earlier-stage stress signals that predict acceleration. Third, serious delinquencies were already rising: the rate reached 1.0% in September 2025, up from 0.9% year-on-year — an early stress signal emerging beneath the headline.
Buy-to-Let Arrears: The Leading Indicator
Buy-to-let mortgage arrears reached 2.5% in Q1 2025 — approximately 2.8 times the owner-occupied rate. This divergence reflects the structural exposure of the BTL cohort: landlord borrowers have no fixed-income anchor against rising rates, and their cashflows are directly exposed to tenant financial deterioration. Approximately one in five UK households now rents privately; as renter financial vulnerability rises, tenant payment defaults increase, which in turn pressures landlord mortgage payments. BTL arrears have historically preceded owner-occupied arrears by 6–12 months, making the current BTL rate a meaningful forward signal for the broader system.
The Debt-Servicing Ratio: A Linear, Not Threshold, Risk
Bank Underground research (2024) established that the relationship between mortgage debt-servicing ratios (DSR) and arrears probability is smooth and linear — not a discrete cliff above some critical threshold. This has profound implications: deterioration across the entire DSR distribution matters for financial stability, not merely tail risk. The current distribution places approximately 40% of mortgagors below 15% DSR (low stress), approximately 50% between 15–30% (manageable but vulnerable), approximately 7–10% between 30–40% (elevated stress), and approximately 2–5% above 40% (high stress). A modest rightward shift of 2–3 percentage points across the distribution — conceivable under employment stress — would move a significant share of the mortgage population into elevated-stress territory.
The unemployment transmission is direct: a 1 percentage point rise in unemployment historically correlates with a 30–50% increase in mortgage arrears. At current unemployment of approximately 3.8%, a rise to 5% would push arrears from 0.9% toward 1.5–2.0%. The capital impact is material: system-wide mortgage losses of £10 billion would reduce bank lending capacity by approximately £90 billion at the regulatory 11% Tier 1 minimum.
High-LTV Lending Expansion: A Recent Negative Trend
A significant structural shift has emerged since 2024. First-time buyer average LTV reached 77.3% — a 15-year high. The share of gross mortgage advances with LTV exceeding 90% rose from 6.7% (Q3 2024) to 7.1% (Q2 2025). The supply of 95% LTV mortgages reached approximately 18-year highs in February 2026. This expansion reflects both easing regulatory constraints and competitive pressure among lenders.
The financial stability implications are severe. Loss-given-default (LGD) rises sharply with LTV: below 60% LTV, LGD is typically 5–10%; at 80–90% LTV, it rises to 20–30%; above 90%, it can exceed 40–50%. A house price decline of 15% — historically plausible in recession — would push mortgages with LTV above 85% into negative equity. Underwater mortgages show 5–10 times higher default rates than mortgages with equity cushion, creating potential for cascade effects if price declines are sufficient to generate substantial negative equity populations.
Basel 3.1 and the Regulatory Paradox
The PRA's implementation of Basel 3.1 (effective January 2026, full phase-in by 2030) recalibrates how banks measure risk and allocate capital. Under the standardised approach, owner-occupied mortgage risk weights range from 20–70% depending on LTV; buy-to-let and cash-flow-dependent properties attract 45–70%+. Higher capital requirements per pound of mortgage lending create return-on-equity pressure, forcing banks to tighten underwriting standards, reduce average loan sizes, or reduce lending volumes.
The result is a policy paradox: macroprudential regulation intended to prevent defaults by improving bank resilience actually causes defaults by reducing money creation and destroying demand in the real economy. Credit rationing begins before defaults occur. The mechanism is not theoretical — it is the operational transmission channel between regulatory tightening and housing exclusion.
2.2 Dimension Two: Mortgage Lending Concentration and the Collateral Feedback Loop
Residential mortgages comprise approximately 60% of all UK bank lending to the private sector — approximately £1.73 trillion of the £2.87 trillion total MFI sterling lending stock. This concentration is not a market equilibrium; it is a post-GFC anomaly driven by regulatory incentives. Pre-2008, housing represented 50–55% of bank credit. The surge to 60%+ reflects the capital efficiency advantage that Basel risk-weighting confers on mortgage lending relative to business lending: residential mortgages attract 20–70% risk weights versus 65–135% for corporate exposures. For a capital-constrained bank, the optimal allocation is mortgage-heavy.
Comparative international data confirms the UK's exceptional position: Canada exhibits 55–60% mortgage concentration; the Eurozone averages 45–50%; the United States, 40–45%. The UK's 60%+ concentration means housing-market shocks transmit directly and immediately to bank balance sheets — a structural vulnerability that no amount of individual bank resilience can fully offset.
Business lending has been the casualty. Corporate lending fell from approximately 30–35% of total bank credit pre-GFC to approximately 20–25% currently. SME lending has been particularly weak: the proportion of SMEs actively seeking credit fell from approximately 25% to approximately 15% post-crisis, with an increasing share turning to non-bank sources. The result is a two-speed credit system in which residential mortgage flows readily while productive business investment faces structural constraint.
The Absorption Rate Constraint: Supply Cannot Compensate
The absorption rate — the rate at which newly built homes can be sold without materially disturbing market price — represents the binding near-term constraint on UK housing supply. Major housebuilders maintain sales rates within a relatively narrow band: approximately 0.45–0.8 homes per sales outlet per week across the cycle, currently 0.5–0.6 on a forward-looking basis. With approximately 3,500 active sales outlets across England, this implies annual new home sales of approximately 90,000–110,000 — against a documented need of 340,000 homes annually. The deficit is approximately 63%.
This constraint is not a physical limit. It reflects developer incentive structures: margin-per-unit optimisation takes priority over volume. Developers pace sales to protect prices; releasing too many homes too quickly would depress the very asset values that underpin their balance sheets and future land options. The absorption rate is therefore invariant to standard supply-side policy — a point developed fully in Chapter 3.
Savills' research documents that the number of sites gaining planning consent fell 31% over the five years to 2023, even where total consented plot volumes held relatively stable. Consent approvals are increasingly concentrated on fewer, larger sites, constraining outlet growth and limiting opportunities for smaller builders and new entrants. The pipeline of outlets is narrowing even as planning reform discussions continue.
2.3 Dimension Three: M4 Money Supply — Structural Dependency on Housing Credit
In the modern UK banking system, money is created through the act of lending, not through the multiplication of central bank reserves. When a commercial bank approves a mortgage, it simultaneously creates a loan asset and a deposit liability — new purchasing power. The Bank of England's 2014 paper Money Creation in the Modern Economy formalised this: "Rather than banks lending out deposits that are placed with them, the act of lending creates deposits — the reverse of the sequence typically described in textbooks."
Because residential mortgages comprise 60% of all bank credit, the M4 money supply has become structurally dependent on housing credit originations. When mortgage volumes are strong, M4 grows. When mortgage volumes weaken, M4 growth stalls. Unlike diversified credit systems where weakness in housing can be offset by strength in business lending, the UK system has no such offset: business lending is weak and non-cyclical; consumer credit is volatile and small; government lending is policy-dependent. Housing cycles dominate M4 dynamics.
Current Monetary Insufficiency
As of October 2025, M4 growth ran at approximately 2.5–3.5% annually — notably below the UK's nominal GDP growth trend of 4–4.5%. Monthly net lending to the private sector stood at £13.0 billion, down from £19.6 billion in September — a 32% month-on-month deceleration. The composition reveals the constraint: household net borrowing totalled £5.4 billion (£4.3 billion mortgages, £1.1 billion consumer credit), while private non-financial corporations actively repaid a net £4.8 billion. Money creation is concentrated on household housing collateral; corporate balance sheets are deleveraging. If household mortgage demand weakens, there is no offsetting corporate demand. The system must slow.
Over three years, a shortfall of 1–2 percentage points below trend represents approximately 4% of GDP — approximately £120 billion of missing money supply. In a high-debt economy, nominal income growth shortfalls translate into rising real debt burdens: fixed debt on falling nominal income triggers defaults even without unemployment increases.
M4 Velocity Collapse: The Hidden Signal
M4 velocity — nominal GDP divided by M4 stock — has declined from 1.1–1.2 pre-GFC to approximately 0.90–0.95 currently: a 15–20% fall. This indicates households are accumulating precautionary savings, perceiving future scarcity. October 2025 data confirms this: interest-bearing sight deposits rose £5.5 billion and ISAs rose £4.2 billion in a single month. In the accounting identity, nominal GDP = M4 × Velocity. If M4 grows 2.5% and velocity declines 1% annually, nominal GDP growth is 1.5% — well below the 4% trend required to service existing debt loads without deterioration.
2.4 Dimension Four: Affordability as Allocation Failure
The UK housing affordability crisis presents a fundamental paradox: official statistics describe a severe housing shortage, yet substantial vacant and underutilised stock exists. Government targets 300,000 new homes annually; research estimates need at 340,000; current supply is approximately 233,000. Yet simultaneously, approximately 700,000+ derelict and long-term empty properties exist, alongside 500,000+ second homes and millions of underoccupied dwellings. The system contains 1.5–2.0 million potentially available homes.
This paradox resolves when understood as an allocation crisis, not a shortage crisis. Prices at 8–10 times earnings signal severe scarcity. Yet turnover has collapsed from 9% of stock annually pre-GFC to 3.7% currently — a 59% decline. In a functioning market clearing via price, turnover should be inversely correlated with price-to-earnings ratios: higher prices reduce quantity demanded, reducing turnover. The UK shows both extremely high prices and extremely low turnover simultaneously — the signature of a market clearing by rationing, not by price adjustment.
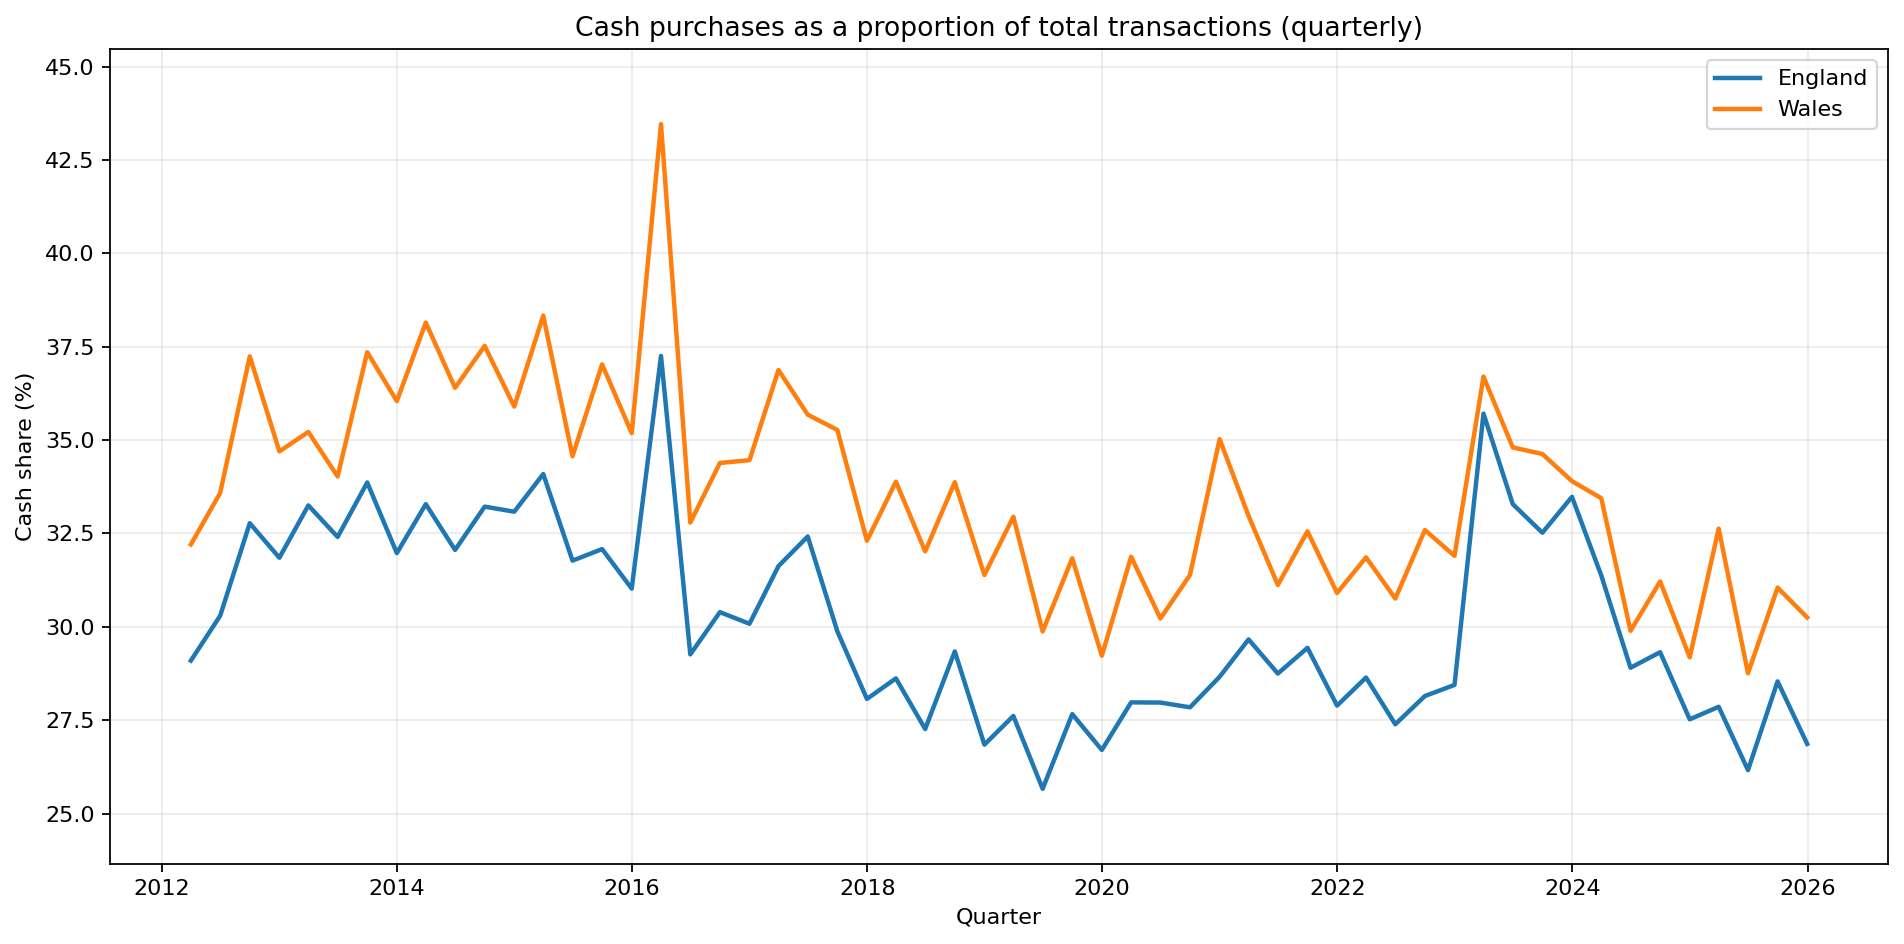
Compositional Clearing: The Cash-Share Signal
The rising cash share of transactions is the clearest empirical signal of compositional clearing. HM Land Registry data (available from March 2012) shows cash buyers have represented a stable 30–35% of all transactions since that date — approximately 35% as of February 2026. Pre-GFC, cash buyers represented sub-10% of transactions. This structural shift indicates that as prices rose from 5× to 8–10× earnings, mortgaged buyers — particularly first-time buyers and younger cohorts — were progressively rationed out, and cash-capable buyers filled the vacuum. The market does not clear by price adjustment reducing quantity demanded uniformly; it clears by excluding certain buyer cohorts entirely.
The Verified Demand Trap
Banks underwrite mortgages using income multiples of 4.5–5.5× and stress-tested affordability. At 4.5× income and a 6% effective stress rate (4% mortgage rate plus 2% buffer), a £50,000-income household can borrow up to £225,000 — implying a debt-servicing ratio of approximately 33% of gross income at maximum tolerance. Yet effective household demand — the amount a household can sustainably borrow while maintaining living standards and savings — is typically 30% lower. The same household budgeting at 20% of after-tax income for housing can sustain a mortgage of approximately £110,000.
The gap between verified demand (£225,000) and effective demand (£110,000) is the engine of long-run price inflation. Prices are bid up to the verified ceiling; effective-demand buyers are rationed out; the marginal transacting buyer is the one leveraging to the maximum approved amount. Over decades, this mechanism drove the price-to-earnings ratio from approximately 3× in 1980 to approximately 8–10× today — not because incomes fell, but because the credit ceiling rose faster than incomes and prices followed it.
2.5 The Integrated Feedback Loop
The four dimensions do not operate independently. They form a coupled system with reinforcing feedback loops. The complete cascade — from current conditions to potential crisis — develops as follows:
- Affordability stress (8–10× P/E) and turnover collapse (3.7%) mean the market is already clearing by rationing.
- As turnover falls further, absorption tightens: developers reduce volumes, supply falls toward 80,000–90,000 homes annually.
- Fewer transactions mean fewer mortgage originations: M4 growth decelerates from ~3% toward 1–2%.
- Slower money supply growth reduces household purchasing power: consumption weakens, business confidence falls.
- Unemployment rises (1–2 quarter lag): wage growth stagnates, labour market slack builds.
- Fixed debt on lower nominal income shifts the DSR distribution rightward: vulnerable cohorts move into elevated stress.
- Credit impairment spikes: arrears accelerate from 0.9% toward 1.5–2.0%; bank write-off losses accumulate.
- Banks tighten lending standards to protect capital: mortgage approvals fall further, from ~65,000/month toward ~45,000.
- Accelerated decline in originations contracts M4 further — potentially into negative territory.
- Deflationary spiral: nominal GDP growth collapses; real debt burdens rise; employment deteriorates further.
This cycle typically develops over 12–24 months from initial shock to full crisis manifestation. Endogenous triggers are less likely — demand has already been substantially rationed by affordability. Exogenous triggers are more probable: a geopolitical shock, a sharp unemployment rise, rate volatility, or financial contagion from elsewhere. Any trigger pushing unemployment above 5% initiates the cascade described above.
| Phase | Months 0–3 | Months 4–6 | Months 7–12 | Months 13–24 |
|---|---|---|---|---|
| Turnover | 3.7% | Falls to ~3.0% | Falls to ~2.5% | Cliff risk <2% |
| M4 Growth | ~3% | Decelerates to ~2.5% | Falls to 1–2% | Possible contraction |
| Unemployment | 3.8% | 4.1–4.3% | 4.5–5.0% | 5.5–6.5%+ |
| Mortgage Arrears | 0.9% | Rising to ~1.1% | Accelerating to 1.3–1.5% | Crisis levels >2% |
| Credit Standards | Tightening starts | Accelerated tightening | Major tightening | Severe rationing |
- Short-term (0–12 months): Stable; stress unlikely without exogenous shock.
- Medium-term (1–3 years): Vulnerable; endogenous fragilities building.
- Long-term (3–5 years): Unsustainable; crisis probable without structural reform.
Probability distribution: stable scenario 40–50%; moderate stress 30–40%; crisis scenario (>2% arrears, financial stability concerns) 15–25%.
Chapter 3 — Why Standard Responses Fail, and What Structural Reform Requires
The four-dimensional diagnosis in Chapter 2 has a direct policy implication: if affordability deterioration is driven by credit-channel dynamics, absorption-rate constraints, and monetary dependency — rather than by a simple physical shortage — then standard policy responses will not resolve it. They address symptoms while the structural engine of exclusion continues to run. This chapter examines each standard response category in turn, explains precisely why it fails, and sets out what structural reform would actually require.
3.1 Why Standard Responses Fail
Monetary Policy: Rate Cuts
Reducing the policy rate improves mortgage affordability and increases mortgage demand — typically by 10–20% for a 100–150 basis point cut. However, rate cuts cannot overcome the absorption rate constraint. Developers maintain current pacing regardless of demand stimulus: releasing more homes faster would depress the asset values that underpin their balance sheets and land option portfolios. The net effect of monetary easing with an unchanged supply ceiling is price inflation, not affordability improvement. Verified demand rises; effective demand buyers are still rationed out; prices are bid up to the new, higher credit ceiling.
The historical evidence is unambiguous. Help to Buy (£28 billion invested, 2013–2023) correlated with house prices rising 84% while supply rose only 16%. Demand stimulus without supply-side structural change redistributes purchasing power upward through the price level.
Planning Reform and Land Release
Planning reform increases the number of plots on which development is permitted. It does not increase the absorption rate within the outlet system. Developers respond by holding more land in option agreements, delaying development starts, and pacing build-out more slowly across a larger portfolio. The number of sites with planning permission sitting undeveloped has grown over the past decade even as approval rates increased. Effective planning approvals have risen; housing completion rates have remained stuck at or below 240,000 annually.
Planning reform is necessary but not sufficient. It addresses outlet growth potential but cannot overcome developer pacing strategy if profit incentives remain unchanged. The constraint is institutional and incentive-driven, not regulatory.
Fiscal Supply Stimulus
Direct government investment in housing could theoretically bypass the private developer absorption ceiling. However, the scale required is politically infeasible under current frameworks: a programme sufficient to reach 300,000+ annual completions would require £40–60 billion annually plus institutional development capacity that does not currently exist. Even substantial programmes at achievable scale mainly substitute for private supply rather than expanding total delivery. The absorption ceiling shifts upward only if a genuinely different delivery model — with different incentive structures — is deployed at scale.
Macroprudential Tweaks and Temporary Guarantees
Adjusting loan-to-income flow limits, extending mortgage guarantee schemes, or relaxing stress-test thresholds increases verified demand without changing the structural conditions that generate the verified-demand trap. As shown in Chapter 2, the gap between verified demand and effective demand is the engine of long-run price inflation. Widening access to high-LTV lending expands the cohort of borrowers exposed to negative equity risk in the next downturn, increasing systemic fragility while providing only temporary affordability relief.
The Basel III regulatory paradox compounds this: tighter capital requirements applied to a mortgage-dominated system fall hardest on the marginal borrower. Macroprudential tweaks that ease access at the margin while leaving the structural concentration intact are, at best, symptom management. At worst, they increase the amplitude of the next cycle.
3.2 The Policy Table: Symptoms vs Structure
| Problem loop | Symptom-focused lever | Structural lever (examples) |
|---|---|---|
| Mortgage-credit dominance ties financial stability to housing cycles | Macroprudential tweaks; temporary mortgage guarantees | Ring-fenced affordable housing credit (New Circuit of Credit); diversification of bank credit toward productive business lending |
| Thin-market clearing excludes mortgaged households | Stamp duty holidays; first-time buyer grants; Help to Buy | Shared equity models; cooperative homeownership; community land trusts |
| Developer pacing constrains near-term throughput | Planning speed incentives; build-out rate requirements | Counter-cyclical public delivery vehicles; cooperative and community-led development; public build-to-live options |
| M4 dependency on housing credit creates monetary fragility | Quantitative easing; rate cuts | Diversified credit creation through SME and productive investment channels; New Circuit of Credit insulated from asset-bidding dynamics |
| Verified demand inflation drives prices above effective demand | Income multiple caps; stress-test adjustments | Land value capture; community land trusts separating land from housing ownership; decommodification of the land component |
3.3 What Structural Reform Requires
The regime diagnosis implies that resolution requires addressing all four dimensions simultaneously. Structural reform that targets only one dimension will be absorbed by the others. The following are the minimum necessary components of a structural response.
A New Circuit of Credit
The core monetary problem is that affordable housing delivery is tethered to private-market credit cycles. When credit tightens, affordable supply collapses; when credit loosens, it inflates prices rather than expanding access. The Home@ix framework proposes a ring-fenced New Circuit of Credit (NCC) — a dedicated funding channel for affordable housing delivery that does not compete with, or bid up, existing stock. The NCC decouples affordable supply from private-market freeze/thaw cycles and provides the stabiliser term in the Affordable Housing Need identity:
$$AN = HD + (HM \cdot P \cdot AR \cdot D \cdot T \cdot PVC \cdot (F - 1)) + NCC$$
At baseline ($$F = 1$$), the middle term vanishes and need equals effective demand plus the credit stabiliser. The NCC is the mechanism that makes this identity solvable in practice — without it, need always exceeds supply when private credit contracts.
Decommodification: Community Land Trusts and Cooperative Models
Separating land ownership (held collectively) from housing ownership (held individually) breaks the speculative premium that drives the verified-demand trap. Community land trusts have demonstrated the capacity to reduce effective price-to-earnings ratios from 8–10× to 5–6× in comparable markets. Cooperative homeownership replaces speculative investor ownership with participatory community control, removing the incentive to pace sales for margin optimisation. Evidence from Vienna (60% of population in social housing, affordable, with middle-class participation), Singapore (90% homeownership via state-led development), and North Dakota (community banking model with near-zero housing default rates) demonstrates that alternative models can achieve both affordability and access at scale.
Counter-Cyclical Delivery Vehicles
Overcoming the absorption rate constraint requires delivery vehicles with different incentive structures — organisations for which volume, not margin, is the primary objective. Public development corporations, housing associations operating at scale, and community-led developers can pace delivery counter- cyclically: building more when private developers pull back, and absorbing demand that the private market cannot serve. This does not require the state to replace the private market; it requires the state to fill the structural gap that the private market's incentive structure creates.
Credit Concentration Diversification
Reducing the 60% mortgage concentration in UK bank lending requires active policy to redirect credit toward productive business investment — particularly SME lending, which has been structurally weak since the GFC. This is partly a regulatory question (risk-weighting reform to reduce the capital efficiency advantage of mortgage lending over business lending) and partly an institutional question (building the lending infrastructure for productive credit that was dismantled in the post-GFC consolidation of the banking sector).
3.4 The FAIR Indicator as a Reform Monitor
Structural reform of the kind described above operates over years, not quarters. During the transition, policymakers and researchers need a forward-looking monitor that detects whether the regime is improving or deteriorating — and does so before the deterioration is visible in conventional affordability statistics.
This is the operational role of Home@ix FAIR. By combining the credit–price wedge (detecting decoupling between prices and the credit base that finances them) with the turnover term (detecting thin-market clearing), FAIR provides a quarterly signal of regime direction. A sustained FAIR above 20 indicates that the structural conditions for exclusion are intensifying, regardless of what headline price indices show. A sustained FAIR below zero indicates that credit and market-depth conditions are improving — though, as the interpretation bands note, very negative FAIR readings can themselves be stress-driven (post-crash credit collapse rather than genuine improvement in access).
The formal derivation, reproducible construction, and backtesting framework for FAIR are developed in the papers that follow. The chapters above have established the diagnostic foundation: the regime that FAIR is designed to detect, the mechanisms through which it operates, and the structural reforms that would, if implemented, cause FAIR to sustainably improve.
Bibliography
- Archer, Tom, and Ian Cole. "The financialisation of housing production: exploring capital flows and value extraction among major housebuilders in the UK." Journal of Housing and the Built Environment 36 (2021): 1367–1387.
- Barker, Kate. Barker Review of Housing Supply — Securing our Future Housing Needs. Report. HM Treasury, 2004.
- Davis, E. P., and I. D. Saville. "Mortgage lending and the housing market." Bank of England Quarterly Bulletin, Q3 (September 1982): 390–398.
- Engdahl, F. William. Myths, Lies and Oil Wars. Wiesbaden: edition.engdahl, 2012.
- Foye, Chris. "Framing the housing crisis: How think-tanks frame politics and science to advance policy agendas." Journal of Housing and the Built Environment. Forthcoming.
- Lewis, Roger. Affordable Housing OPUS, The Home@ix Formula. Unpublished Draft/Paper.
- Lewis, Roger. "The Data Has Caught Up" — plain-English commentary version. LinkedIn Pulse, 25 February 2026.
- Lewis, Roger. The Ending of the Long Monetary Expansion Cycle and a Brave New World of Housing Realism. Unpublished Draft/Report.
- Lewis, Roger. The Home@ix Bumper Sticker. Report/Statement.
- Lewis, Roger. Home@ix Affordable Homes, A Framework of Understanding. Report/White Paper.
- Lewis, Roger. "Housing Credit, Broad Money, and the Real Economy: A UK View (or, When 'Macroprudence' Becomes a Housing Scheme)." LinkedIn Pulse, 23 February 2026.
- Lewis, Roger. Ten Steps to Affordable Housing: The New Circuit of Credit (The Circle of Blame, Volume 1). Self-Published, 2025.
- Lewis, Roger. "When the Housing Market 'Freezes': What Turnover, Cash Share, and Supply Mix Say About UK Housing Stress." LinkedIn Pulse, 23 February 2026.
- Lietaer, Bernard, and Jacqui Dunne. Rethinking Money: How New Currencies Turn Scarcity Into Prosperity. Book.
- Meen, Geoffrey, and Christine Whitehead. Understanding Affordability: The Economics of Housing Markets. Bristol: Bristol University Press, 2020.
- MMC Playbook. Social Rent Housing at Pace: The MMC Playbook. A Playbook for Local Authorities. Report, May 2024.
- Mulheirn, Ian. Tackling the UK Housing Crisis: Is Supply the Answer? Report. CaCHE (UK Collaborative Centre for Housing Evidence), August 2019.
- Næss-Schmidt, Sigurd, Jonas Bjarke Jensen, Hendrik Ehmann, and Benjamin Christiansen. Impact of the Final Basel III Framework in Sweden: Effects on the Banking Market and the Real Economy. Copenhagen Economics for the Swedish Bankers' Association, February 2020.
- Piddington, Justine, Simon Nicol, Helen Garrett, and Matthew Custard. The Housing Stock of The United Kingdom. Report. BRE Trust, 2017.
- Savills Research. A New Normal for Housebuilding? The Importance of Sales Outlets in a Market Without Help to Buy. Report for Richborough Estates and LPDF, 1 March 2023.
- Sayre, Brian. Disrupt a Broken Industry — The Industrial Construction Sandbox. Report. Shadow Labs LLC, August 2020.
- Shin, Hyun Song. Macroprudential Policies Beyond Basel III. BIS Papers No. 60.
- Shiller, Robert J. Irrational Exuberance (Revised and Expanded Third Edition). Princeton: Princeton University Press, 2015.
- Starkey, Maurice. "Utilising the Quantity Theory of Credit to Understand the Causes of the 2007 Financial Crisis." Economics Network / Creative Commons, 2018.
- Systemic Fiscal Reform Group. "The Principles of Tax Policy." Written evidence submitted to a Parliamentary committee, Session 2010–11.
- Whitehead, Christine, and Peter Williams. Thinking Outside the Box: Exploring Innovations in Affordable Home Ownership. Report. London School of Economics / Housing Evidence, 11 November 2020.
Part I — The 2024 Foundations: Market Function Before Price
Home@ix began from an observation that sounds simple but changes the whole measurement problem: in UK housing stress regimes, the market does not reliably clear through orderly repricing. It often clears through rationing participation. Turnover collapses, transaction chains fail, mortgage-dependent households are screened out, and the observed price index becomes a selected statistic produced by a thinner, wealthier transacting set.
Part I sets the domain terms for the rest of the book. Before we define FAIR (the derived, reproducible regime indicator), we anchor the foundational claim with a canonical diagnostic module: turnover (market liquidity), cash-versus-mortgage dynamics (access to finance), and the balance between new build and old stock activity (delivery and churn capacity).
1. A canonical diagnostic module (market depth, access, and mix)
The exhibits below are treated as a single system lens. Read together, they diagnose whether the housing system is clearing via price, or via quantity and composition (thin-market clearing).
Figure 1 — Turnover and cash share (annual)
Turnover is the housing market's functionality / liquidity indicator: how many homes change hands relative to the stock. Cash share is a participation / exclusion indicator: when cash share rises alongside weak turnover, it is consistent with mortgage-dependent households being rationed out by rates, underwriting, or deposit constraints.
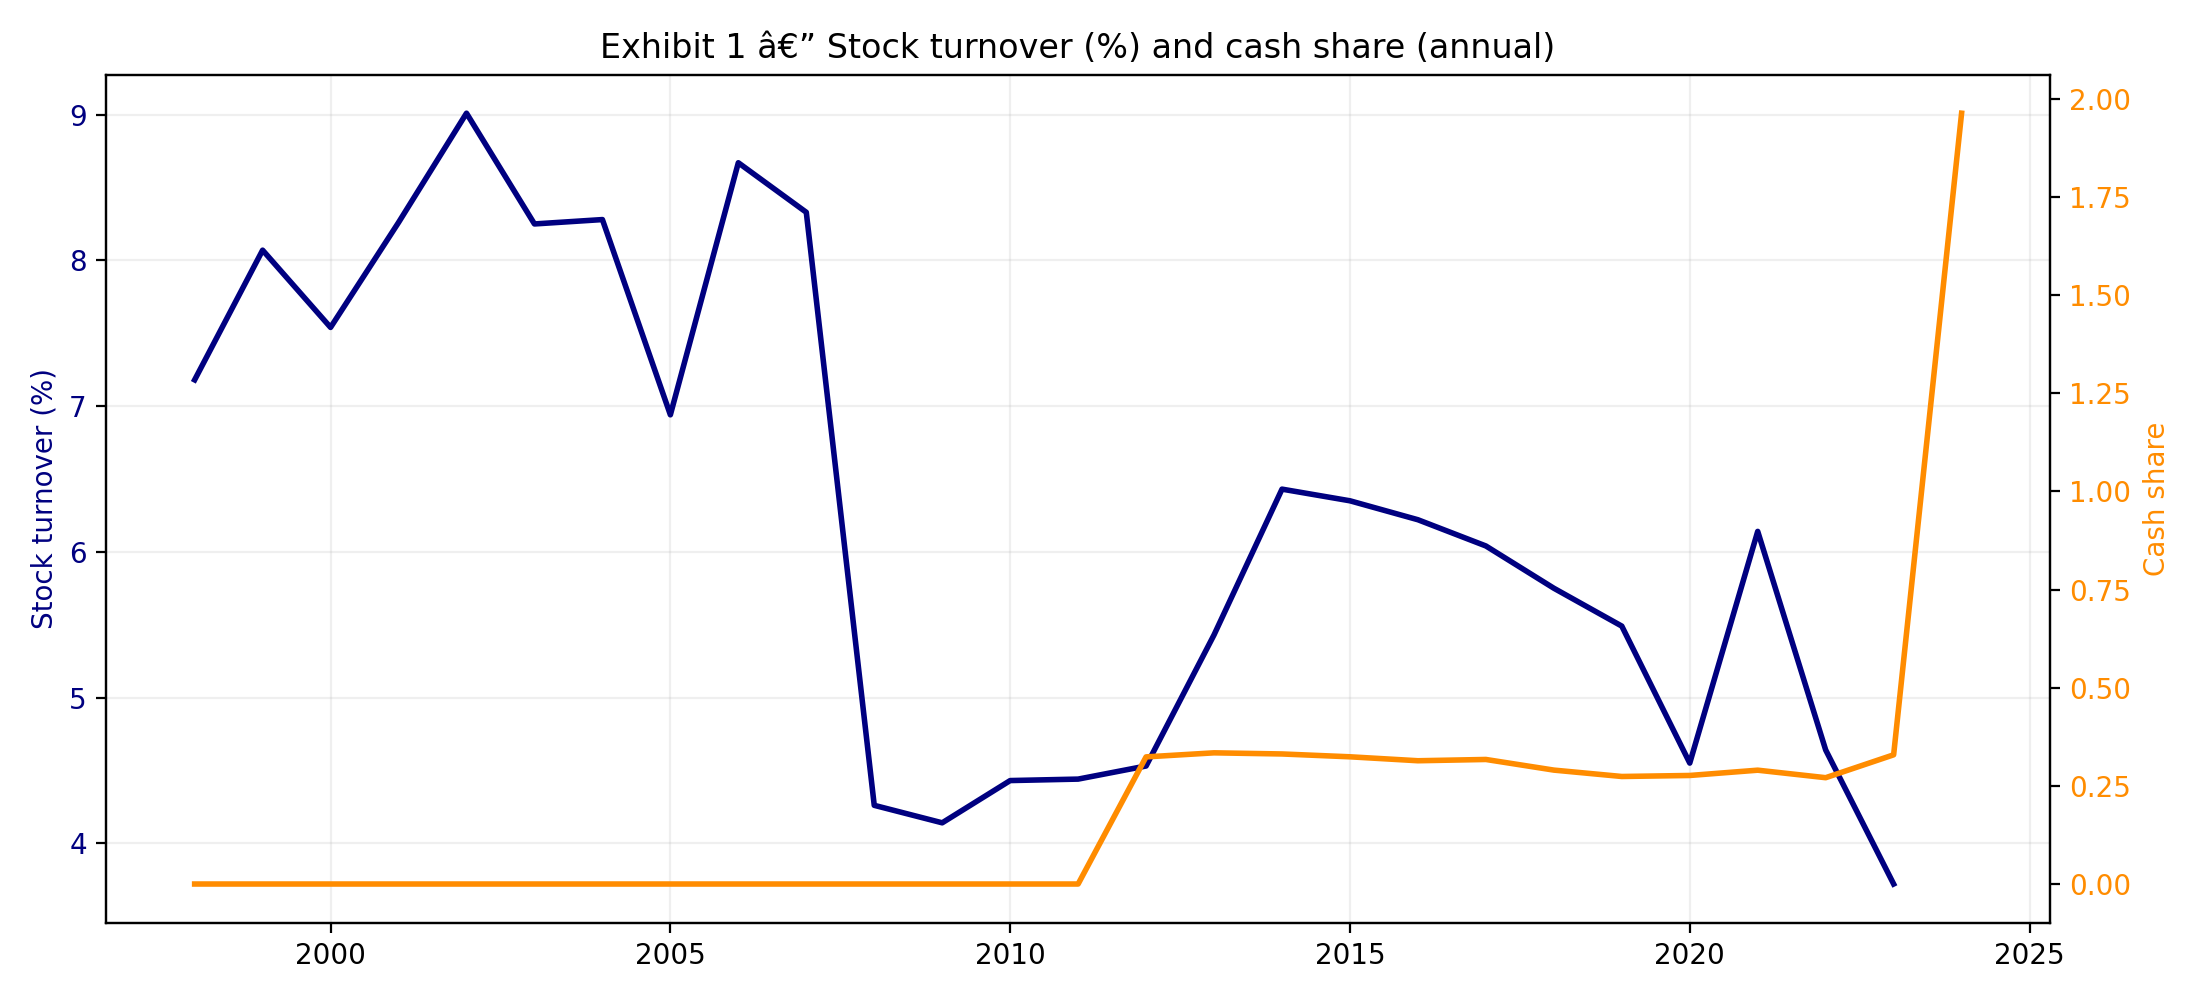
Figure 2a — Transaction levels: old stock vs new build (annual)
"Housing activity" is not one market. Old stock dominates volume and is more credit- and chain-sensitive. New build volumes reflect additional constraints (planning, labour, build finance, developer pacing). The split helps distinguish access/finance stress from delivery/capacity stress.
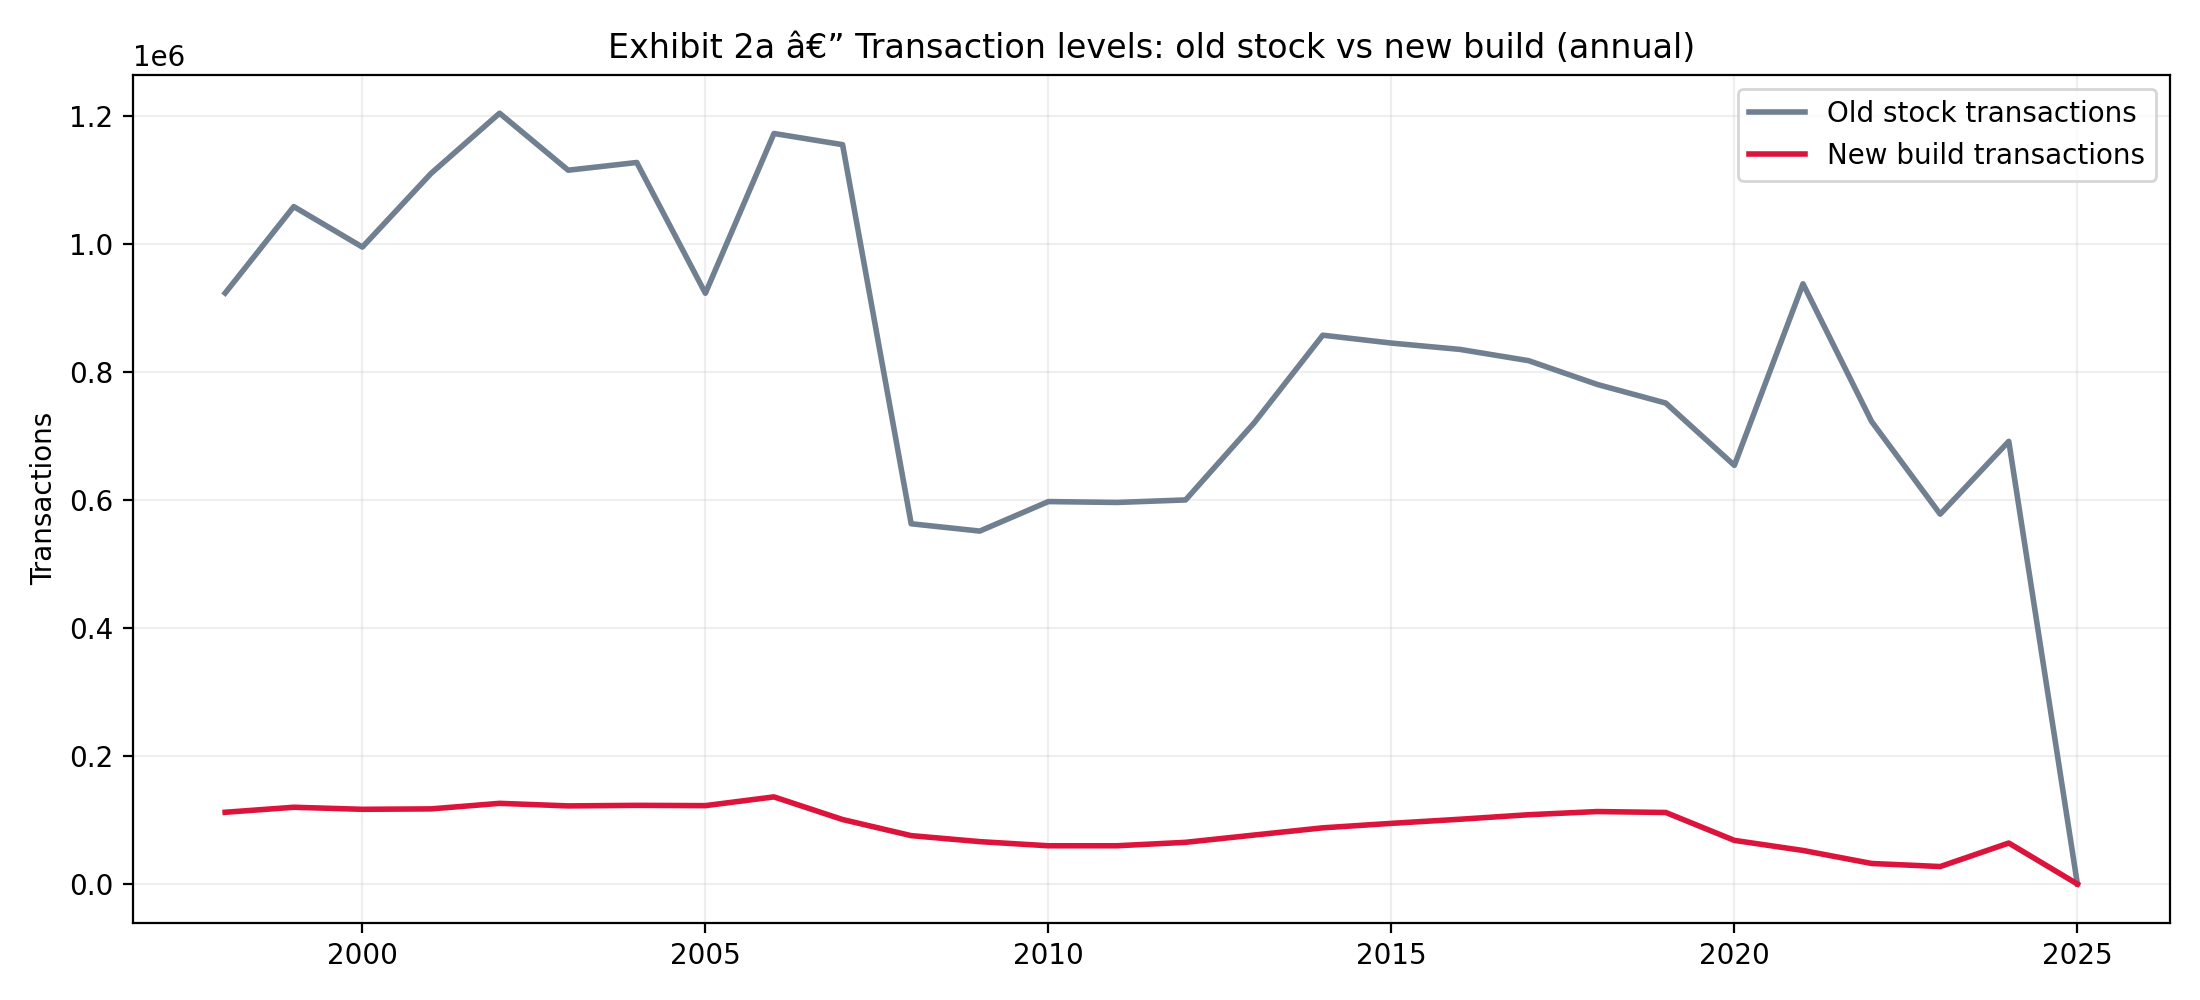
Figure 2b — Transaction mix shares (annual)
Mix shares reveal compositional clearing: who is still able to transact when the market thins. Shifts in shares can signal allocation stress even when headline prices appear stable.
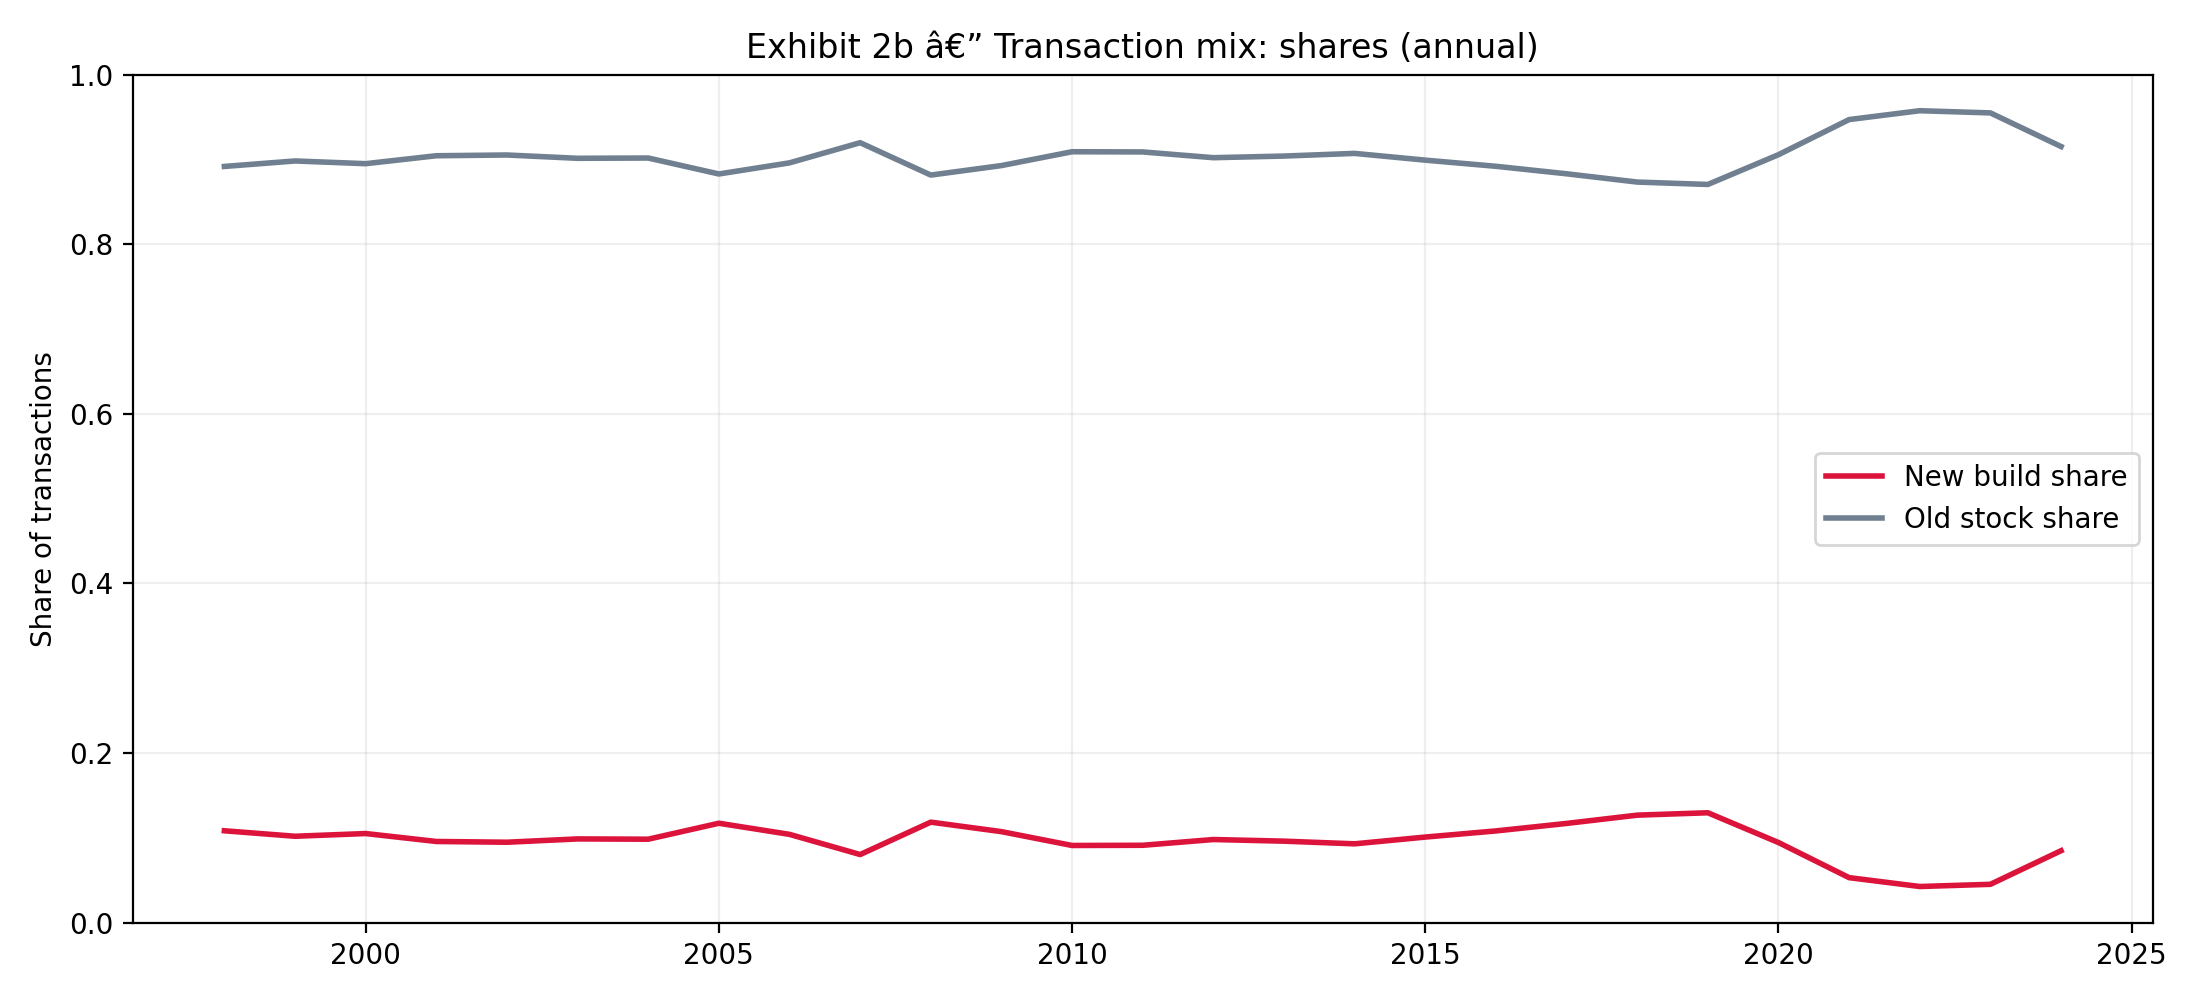
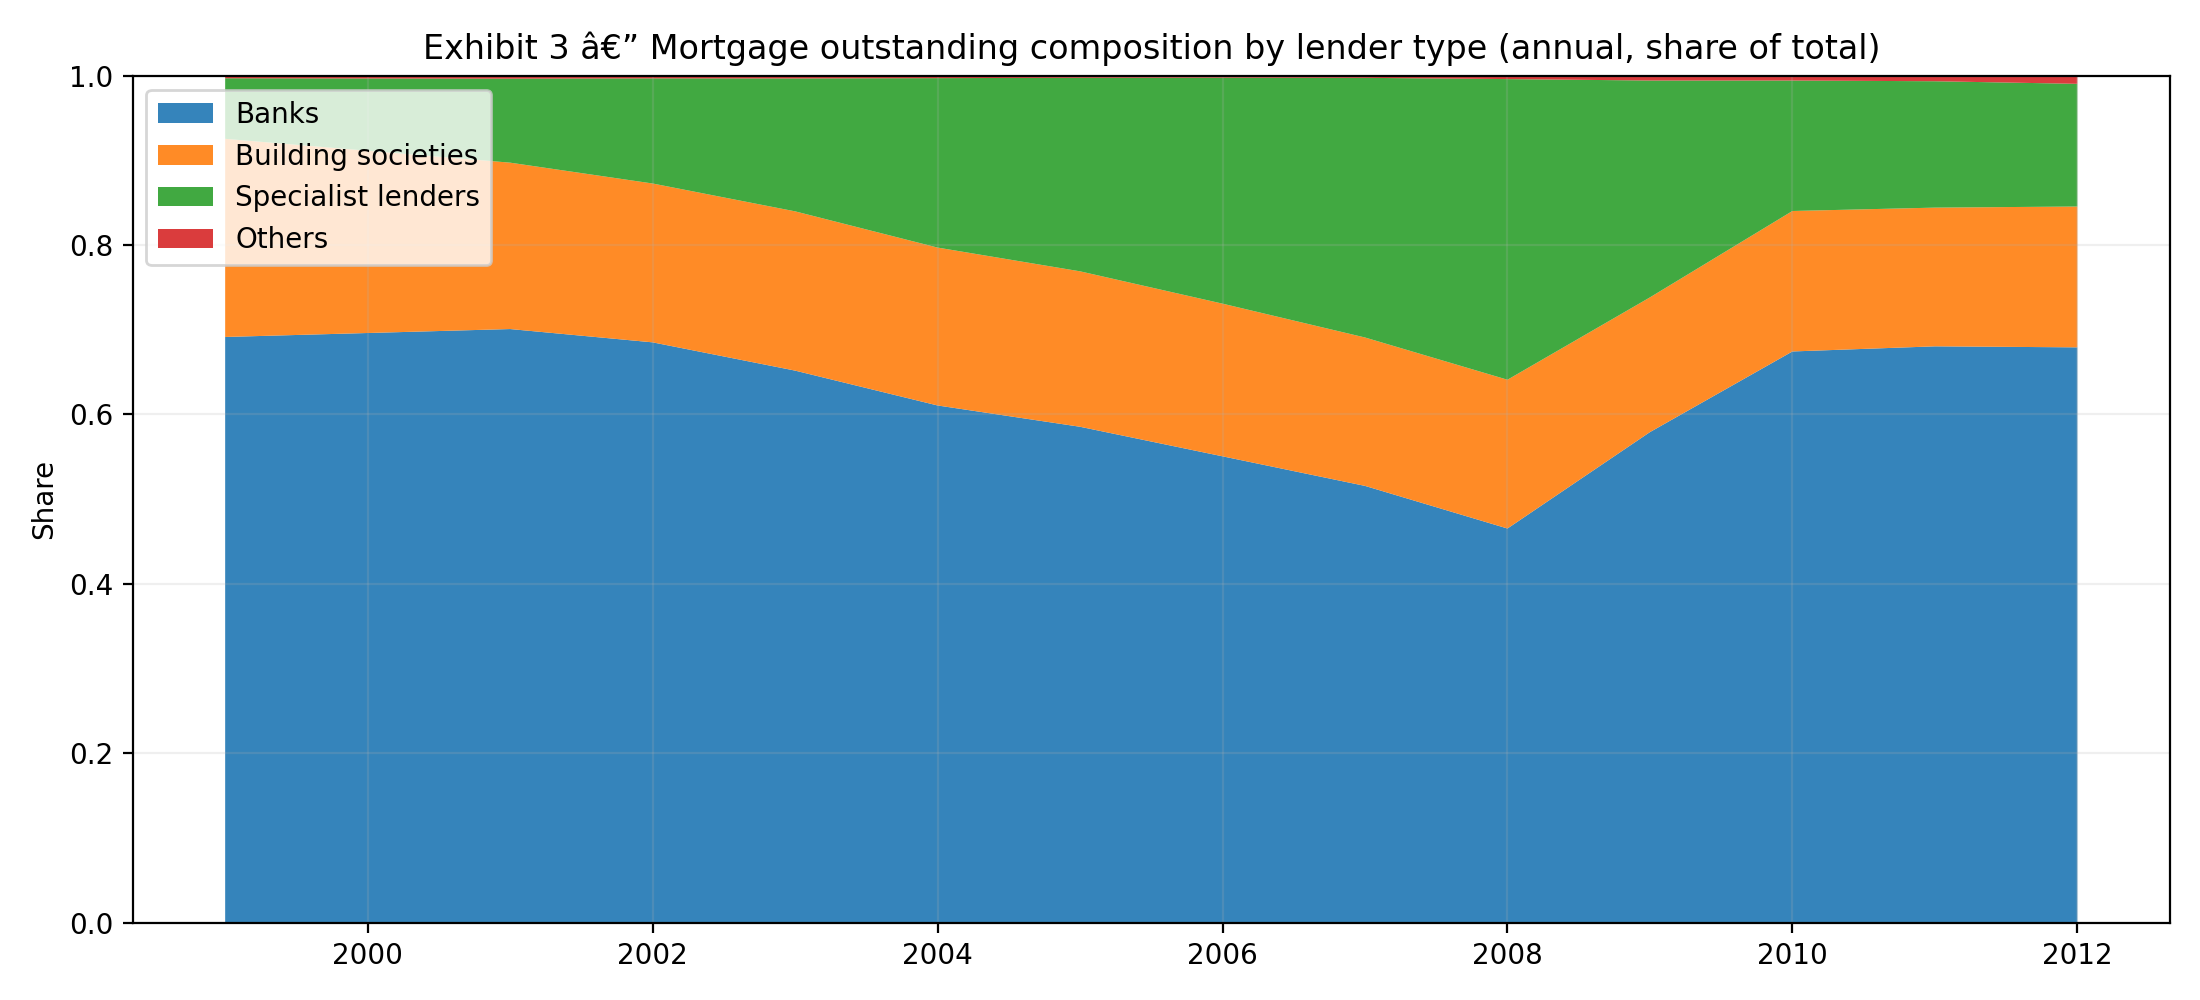
Figure 3 — Mortgage outstanding composition by lender type (annual)
This exhibit shows how the stock of mortgage lending is distributed across lender types. Shifts in composition matter because "credit availability" is not a single dial: it is mediated by lender balance sheets, underwriting posture, and the kinds of borrowers each segment serves.
Home@ix — The Identity (as developed) and the Reproducible Build
Home@ix uses accounting identities to describe the housing system as a throughput machine. The point is not "math for effect". The point is discipline: when the system is constrained by absorption, credit gates, delivery friction, and value-capture reality, output behaves like a set of multipliers. If one dial is near zero, the product collapses.
Identity 1: Affordable Market Supply (AMS)
We start with the supply identity: the affordable supply the system can deliver, given real-world throttles.
Affordable Market Supply:
$$AMS = (HM \cdot P \cdot AR \cdot D \cdot T \cdot PVC) + HS$$
- HM: housebuilding market capacity (deliverable output, not theoretical land)
- P: affordable proportion of delivery
- AR: absorption rate (how fast homes can be sold/let without destabilising price)
- D: diversity (tenure/product mix widening take-up)
- T: throughput (permission → start → completion conversion efficiency)
- PVC: planning value capture that works in practice
- HS: existing affordable housing stock
Identity 2: Affordable Housing Need (AN), derived
Need persists (and often rises) when supply is tethered to private-market throughput and absorption constraints. Home@ix expresses this by introducing a sequencing/fast-tracking factor F and a stabiliser term: a ring-fenced New Circuit of Credit (NCC) that funds affordable delivery without simply bidding up existing stock.
Start from the expanded form:
$$AN = HD + (HM \cdot P \cdot AR \cdot D \cdot T \cdot PVC \cdot F) + HS - AMS + NCC$$
Substitute $$AMS = (HM \cdot P \cdot AR \cdot D \cdot T \cdot PVC) + HS$$ and simplify:
$$AN = HD + (HM \cdot P \cdot AR \cdot D \cdot T \cdot PVC \cdot (F - 1)) + NCC$$
- HD: HomeMaker effective demand (need in households, not only "bankable demand this quarter")
- F: sequencing/fast-tracking factor (baseline at $$F=1$$)
- NCC: New Circuit of Credit Creation (the stabiliser that decouples affordable supply from private-market freeze/thaw cycles)
Reproducibility: from canonical inputs to the figures in this book
- Canonical inputs (source of truth):
inputs/canonical/ - Intermediate processing (rebuildable cache):
build/processed/ - Generated artefacts referenced by papers:
outputs/figures/,outputs/fair_assets/,outputs/draft_paper_assets/ - Portable publication bundle:
publication/print_*/containingindex.htmland copiedassets/
sweep_up/inbox/homeatix_annual_exhibits.py— reads canonical data and generates the Part I exhibits intoassets/figures/sweep_up/inbox/assemble_full_ebook.py— writes the combinedindex.htmlinto the print bundle and normalises asset paths toassets/
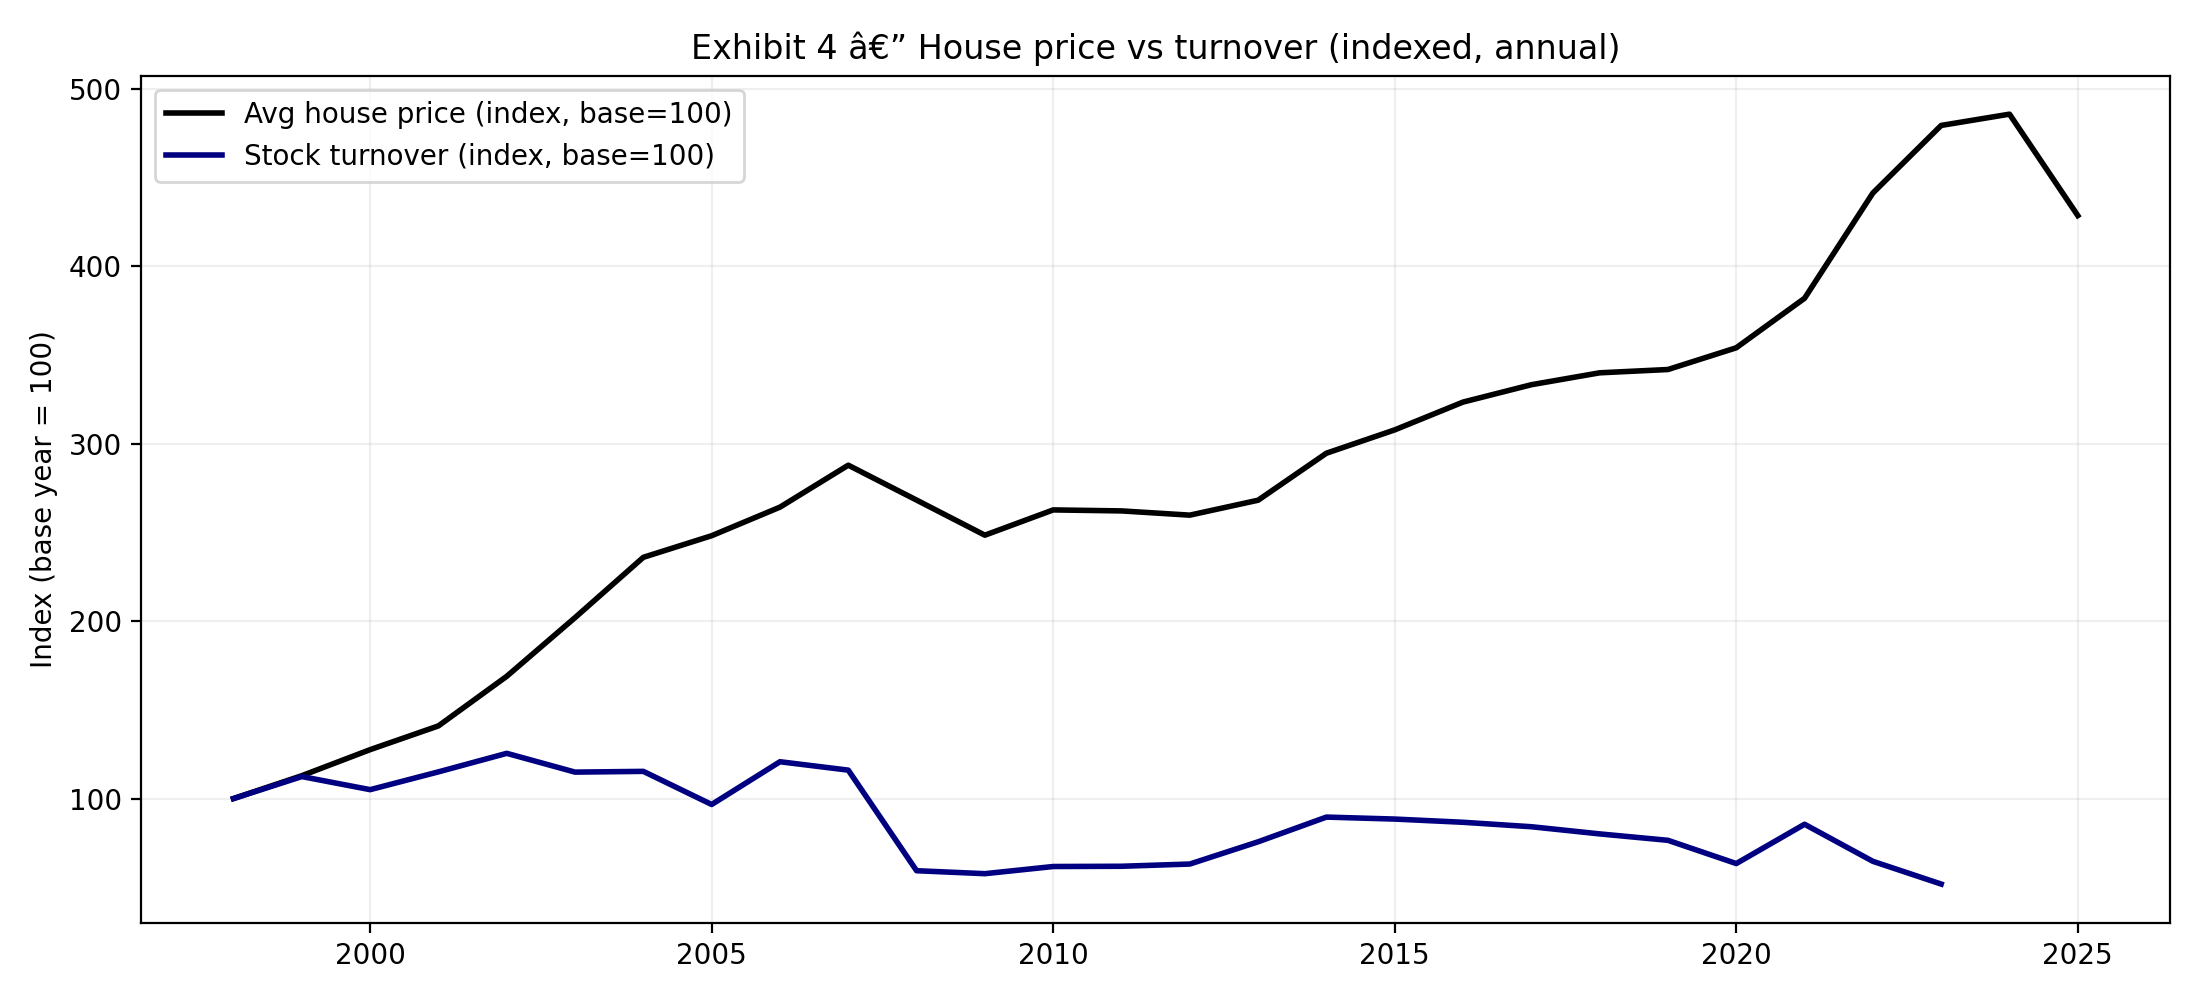
Figure 4 — Indexed price vs indexed turnover (annual)
When turnover collapses, price indices can lag or understate stress because fewer transactions generate weaker price discovery. Liquidity risk becomes macro-relevant.
Supplement — Cash purchases share (England vs Wales, quarterly)
2. Why this forces an accounting identity (and later, FAIR)
3. Source note (reproducibility)
- Exhibits generator:
sweep_up/inbox/homeatix_annual_exhibits.py - Bundled figures:
assets/figures/(relative to thisindex.html)
Follow-up Paper
Home@ix Follow-up: Mortgage-Credit Concentration, M4 Dependency, and UK Housing Affordability Regimes — With a Reproducible Early-Warning Indicator (FAIR)
Abstract
The UK housing affordability crisis is commonly presented as a price-to-income problem. That framing is incomplete in regimes where housing markets do not clear through price adjustment. Under stress, clearing occurs through quantities and composition: turnover falls, chains fail, mortgage-dependent households are rationed out, and the observed price level becomes a lagging and selected statistic.
This paper connects four reinforcing dimensions: (i) credit impairment risk in commercial banks under mortgage-credit concentration, (ii) mortgage lending over-reliance and collateral feedback, (iii) structural dependency of broad money growth on mortgage credit creation, and (iv) affordability deterioration as an access-and-allocation outcome. It then operationalises the diagnosis using Home@ix FAIR, a transparent quarterly indicator designed as a 2–3 year forward regime signal for affordability understood as throughput and access. FAIR combines a credit–price decoupling wedge with a market-depth (turnover) term, optionally augmented by composition proxies.
Executive Summary
UK housing stress is not only about “high prices.” It is also about who can transact and how the market clears. When mortgage credit tightens or uncertainty rises, the UK market often clears via reduced participation rather than orderly repricing: transactions fall, turnover collapses, and cash-rich buyers gain share.
Key findings (sense-checked, definitions required in final)
- Mortgage concentration is systemic: residential mortgages comprise a large share of UK bank private-sector lending stock, increasing transmission from housing shocks to bank balance sheets.
- Broad money is mortgage-sensitive: when mortgage lending slows, broad money growth can undershoot nominal activity trends, reinforcing tight conditions.
- Near-term supply is throughput-constrained: major housebuilders pace sales within a narrow absorption band (sales per outlet per week), limiting market clearing via volume.
- Affordability is an allocation problem in stress: turnover collapses and buyer composition shifts (cash share rises), so the market “clears” by rationing access rather than by repricing alone.
- FAIR provides an operational monitor: FAIR detects credit–price decoupling and thinning market depth, giving a forward-looking regime signal consistent with the diagnosis.
1. The Integrated Mechanism: Why These Four Dimensions Move Together
The four dimensions—bank credit quality, mortgage concentration, broad money dynamics, and affordability—are often analysed separately. In practice, they form a coupled system with feedback loops.
1.1 System sketch (feedback loops)
- Mortgage concentration loop: house prices and employment shocks affect arrears and loss expectations, which tighten underwriting and reduce credit availability.
- Endogenous money loop: mortgage lending creates deposits; weakening mortgage flows reduce broad money growth, which can tighten spending conditions and worsen employment.
- Thin-market loop: tighter credit reduces the set of eligible buyers; turnover falls; observed prices become “stickier” and more selected; access worsens even if the price index moves slowly.
- Developer pacing loop: when demand weakens, builders protect margins by controlling release pace; volume cannot rise enough to clear via supply in the near term.
This paper treats “affordability” as the regime outcome of these loops, not as a single ratio.
2. Credit Impairment: Surface Health vs Structural Fragility
Headline arrears and delinquency can look stable even as systemic vulnerability rises, because compositional selection improves the observed pool of borrowers while stress accumulates in marginal cohorts (recent high-LTV buyers, BTL, renters-in-distress feeding landlord stress).
2.1 Why low arrears can be misleading
- Selection effects: improved observed arrears may partly reflect that the stressed tail stops transacting or is screened out of new lending.
- Threshold reporting: “serious arrears” definitions can miss earlier-stage stress that predicts later acceleration.
- BTL as leading indicator: landlord cashflows are more directly exposed to rate changes and tenant stress; BTL arrears can precede broader deterioration.
2.2 Debt servicing: risk rises continuously
If arrears probability increases roughly linearly beyond a low-stress floor, then stability depends on distribution shifts, not just tail events. Small rightward shifts in the debt-servicing distribution can move a meaningful share of households into elevated stress.
3. Mortgage Lending Concentration and M4 Dependency
In an endogenous money system, bank lending and deposit creation are linked. If mortgage lending dominates bank balance sheets, then housing-credit cycles imprint onto broad money dynamics and can propagate to the real economy.
3.1 What “M4 dependency” means operationally
- Mechanism: new mortgage lending creates deposits; weak mortgage origination can weaken deposit growth.
- Interpretation: slowing broad money growth is not mechanically “bad,” but it becomes a stress signal when it coincides with tight credit, weak turnover, and rising delinquency risk.
- Empirical caution: velocity and portfolio shifts matter; M4 is best used as a regime indicator alongside housing-credit and turnover measures.
4. Housing Affordability as Market Clearing: Access, Allocation, Throughput
In stressed regimes, housing markets can fail to clear via prices and instead clear via participation constraints: fewer mortgage-dependent buyers qualify, chains break more often, and turnover collapses.
4.1 Compositional clearing
- Turnover collapse: when transactions fall relative to stock, the market becomes thin; observed prices reflect a narrower set of buyers and properties.
- Buyer-type rationing: higher cash shares can coexist with sticky prices because cash demand clears the marginal flow even as mortgaged households are excluded.
- Distributional harm: renters and younger cohorts experience the binding constraint (access), even when average ratios look stable.
4.2 The absorption-rate constraint (near term)
New-build supply often cannot surge quickly enough to restore clearing through volume because developers pace sales (per outlet per week) to optimise margins and manage risk. This creates a throughput constraint that is institutional/incentive-driven, not purely physical.
5. From Diagnosis to Tooling: The Home@ix FAIR Indicator
The diagnosis implies two observable precursors to allocation stress that are available in aggregate data: credit–price decoupling and thin-market clearing. FAIR is a reduced-form index that combines both.
5.1 Inputs (quarterly)
- House prices (level):
avg_house_price_gbp - Mortgage stock (level, £m):
mb_total_gbp_m - Turnover (market depth):
turnover_pct_q - Optional: new-build share:
newbuild_share_of_transactions - Quarter index:
period; geography:geo(e.g., EW)
5.2 Derived series
Define year-on-year growth rates:
Define the credit–price wedge:
Optional new-build share change (YoY):
6. Baseline Normalisation (Core Proviso)
To avoid defining “normal” using crisis regimes and structural breaks, z-scores are computed from pooled baseline windows:
- Baseline windows: 2003Q1–2007Q4 and 2013Q1–2019Q4
- Excluded: 2008–2012 (GFC and aftermath) and 2020+ (Covid and subsequent regime breaks)
For any series $$X_t$$, define:
where $$\mu_X$$ and $$\sigma_X$$ are computed using baseline quarters only.
7. FAIR Definition, Interpretation, and Monitoring
FAIR is scaled for interpretability and designed to be auditable. Weights are intentionally simple and can be stress-tested.
7.1 FAIR definition
Default (three-component) specification:
If the new-build term is not available:
7.2 Direction-of-flow
The level indicates regime pressure; the first difference indicates acceleration or easing.
7.3 Practical interpretation bands
- $$FAIR \ge 50$$: strong deterioration regime risk
- $$20 \le FAIR < 50$$: mild deterioration bias
- $$-20 \le FAIR < 20$$: neutral/noisy
- $$-50 \le FAIR < -20$$: mild improvement bias
- $$FAIR < -50$$: strong improvement regime (often stress-driven)
8. Evaluation: Event-Based Backtesting (Crash-Start Definitions)
FAIR can be evaluated as an early-warning tool using objective event definitions rather than narrative dating.
8.1 Crash-start events (rule-based)
A “crash start” may be defined as a local price peak followed by a drawdown of at least $$X\%$$ within $$Y$$ quarters, with a minimum separation (cooldown) of $$C$$ quarters to avoid double-counting clustered peaks.
8.2 Illustrative warning rules
- A: sustained level stress: $$FAIR > 20$$ for 2 quarters
- B: sustained acceleration: $$\Delta FAIR > 5$$ for 2 quarters
- C: broad stress-worsening: $$FAIR > 0$$ and $$\Delta FAIR \ge 0$$
8.3 Metrics
- Lead time (quarters) from the most recent signal to each crash start
- False-positive proxy: share of signal quarters not followed by any crash start within a forward window (e.g., 8 quarters)
9. Outputs and Visualisations (Reproducible)
This draft renders the latest FAIR assets directly from the Home@ix output folders.
All paths below are relative to the server root (the folder you run py -m http.server in).
9.1 FAIR headline level
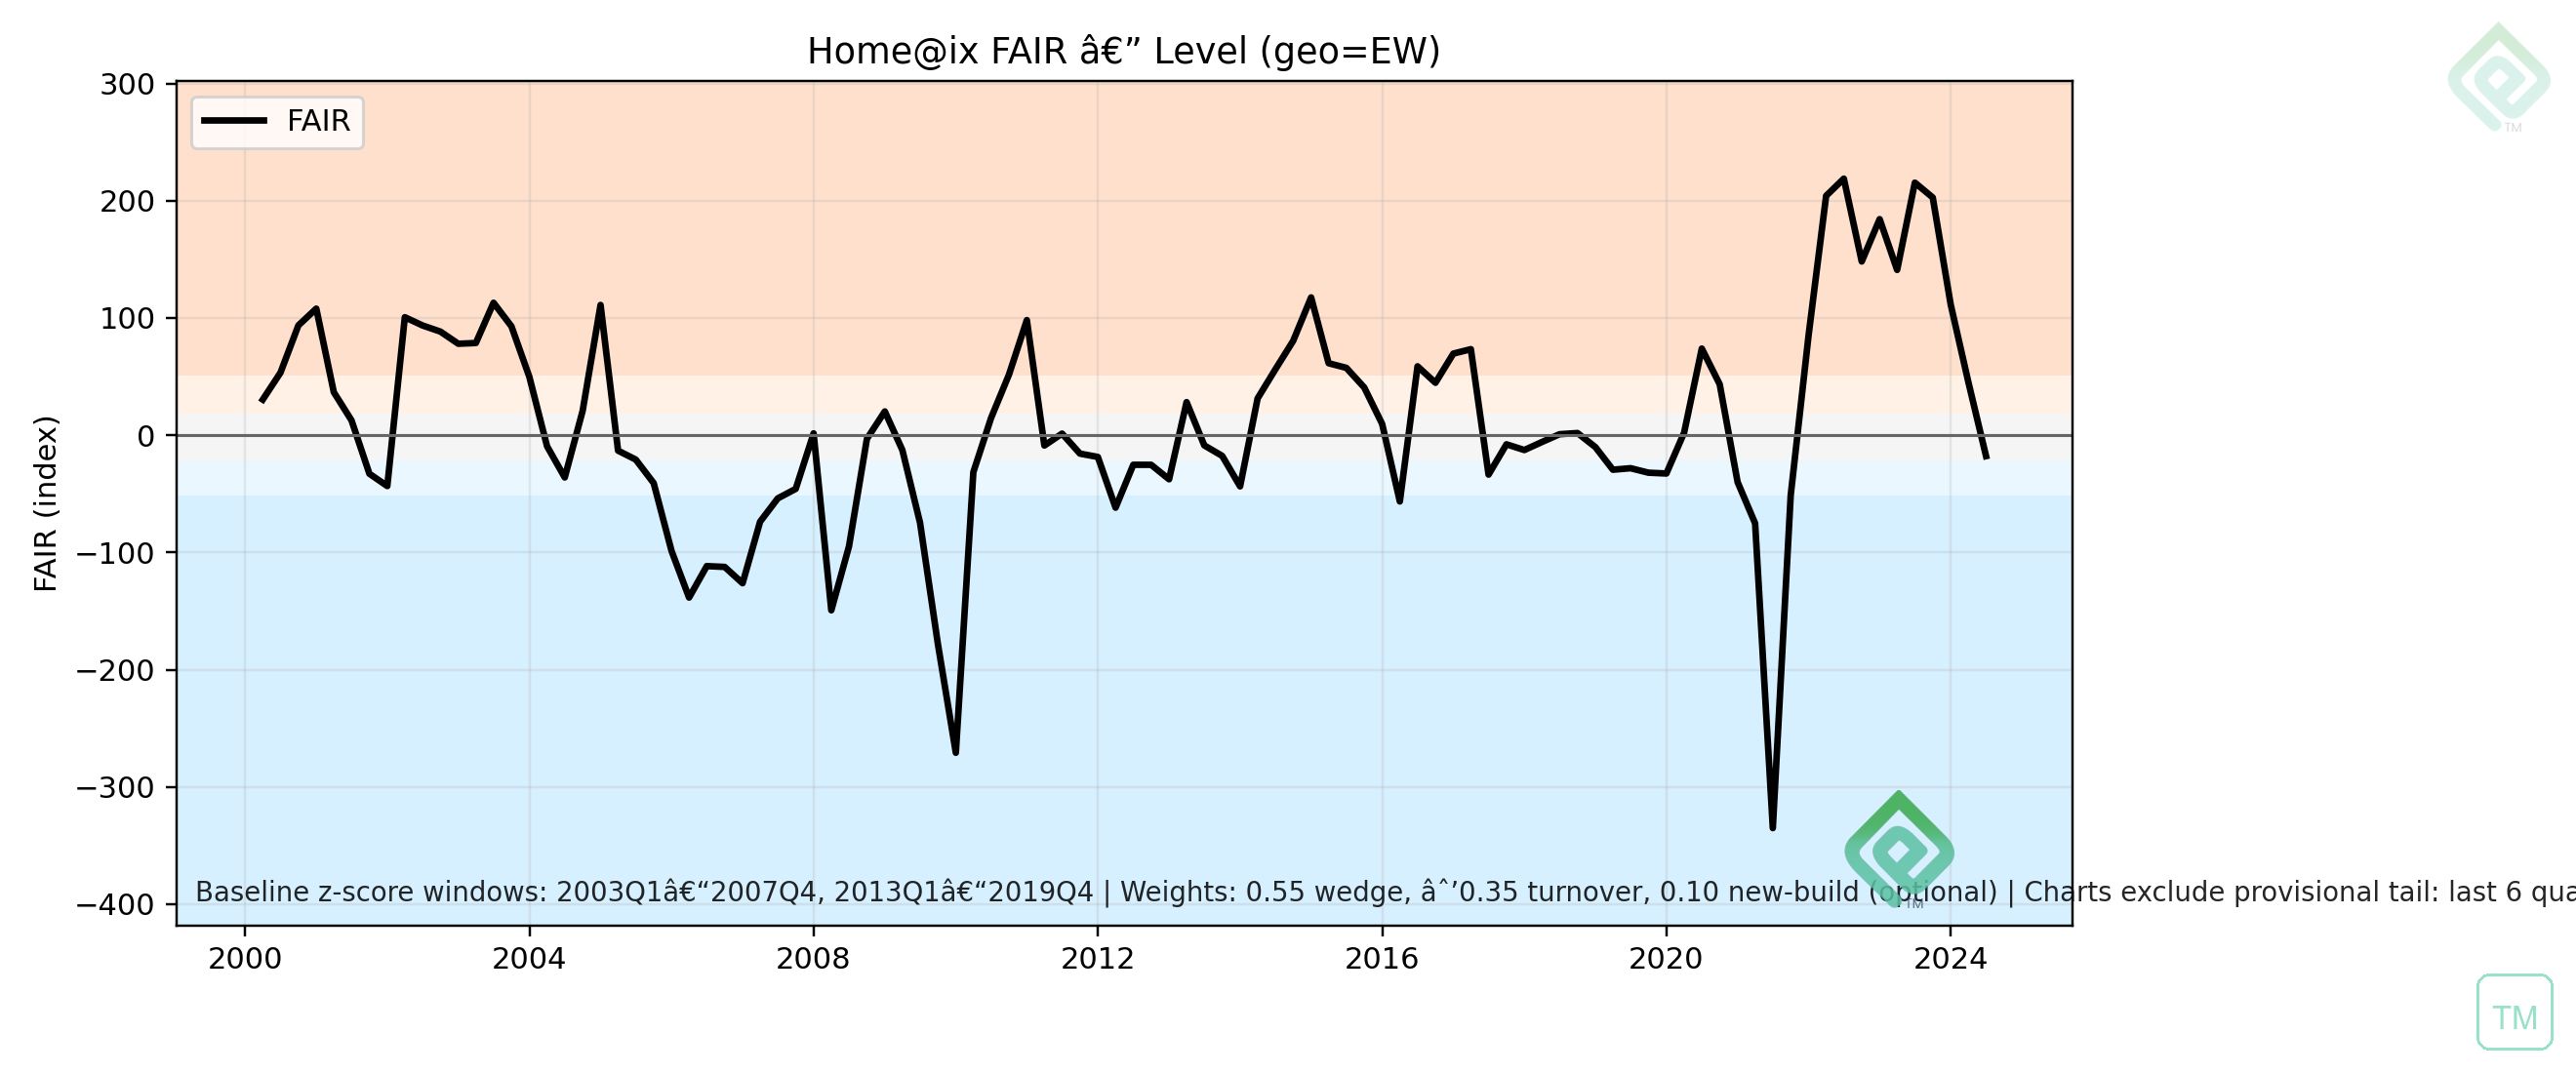
assets/figures/fig_fair_level.png
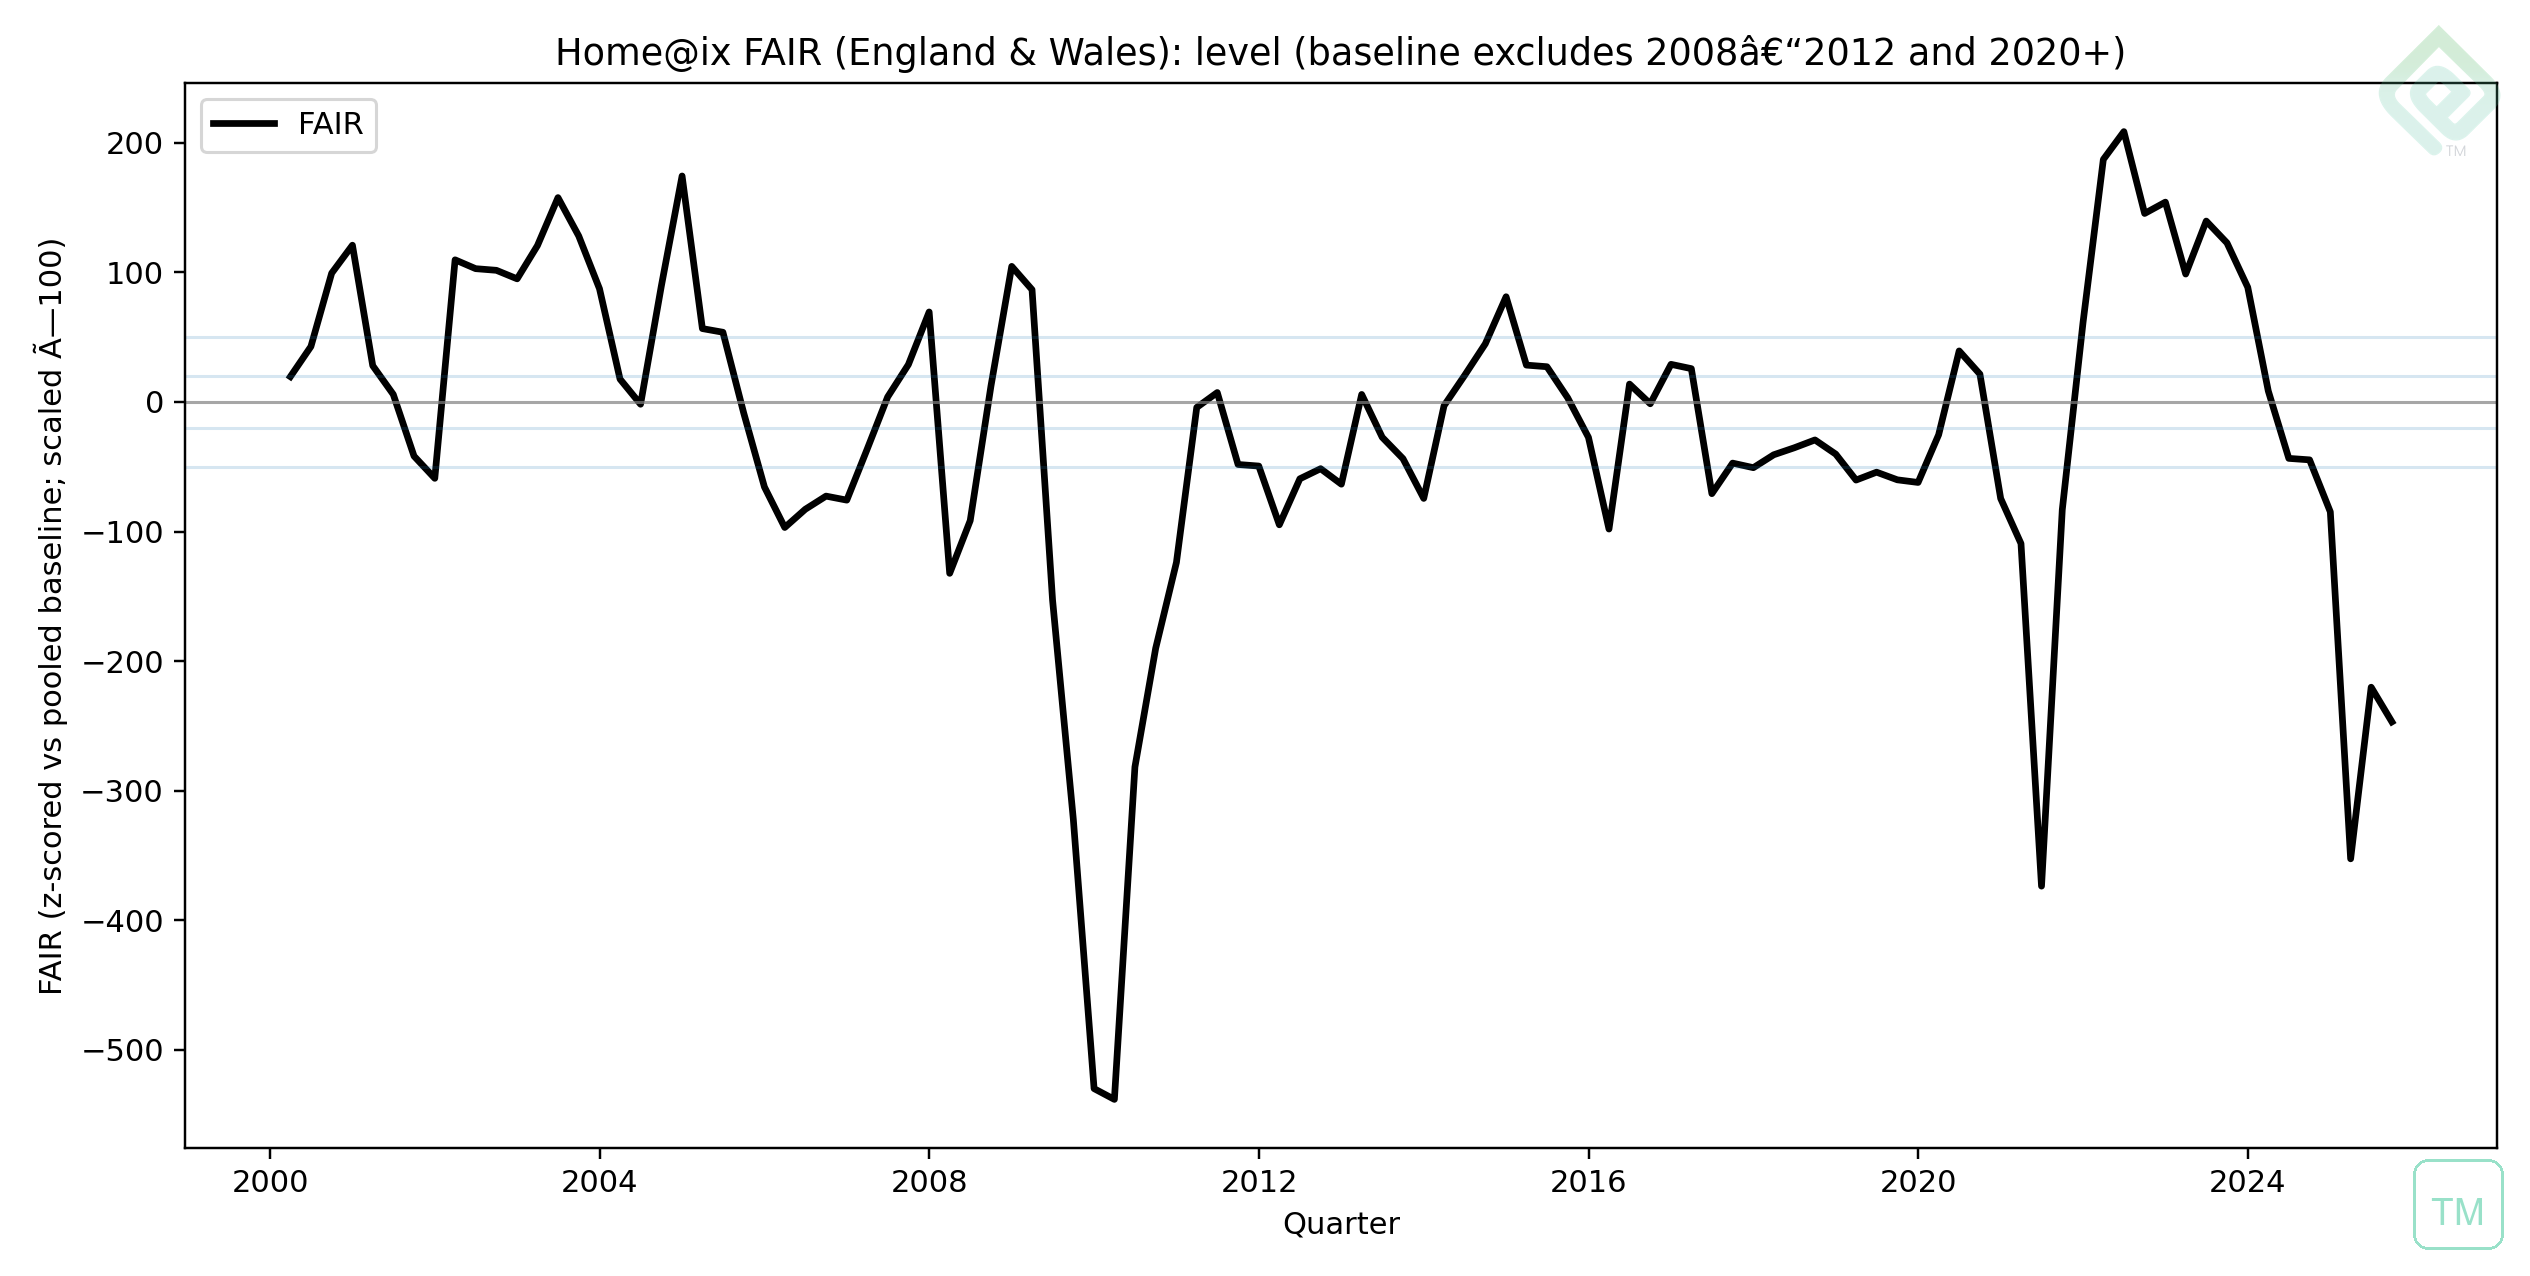
assets/fair_assets/fig_fair_level.png
9.2 Component contributions
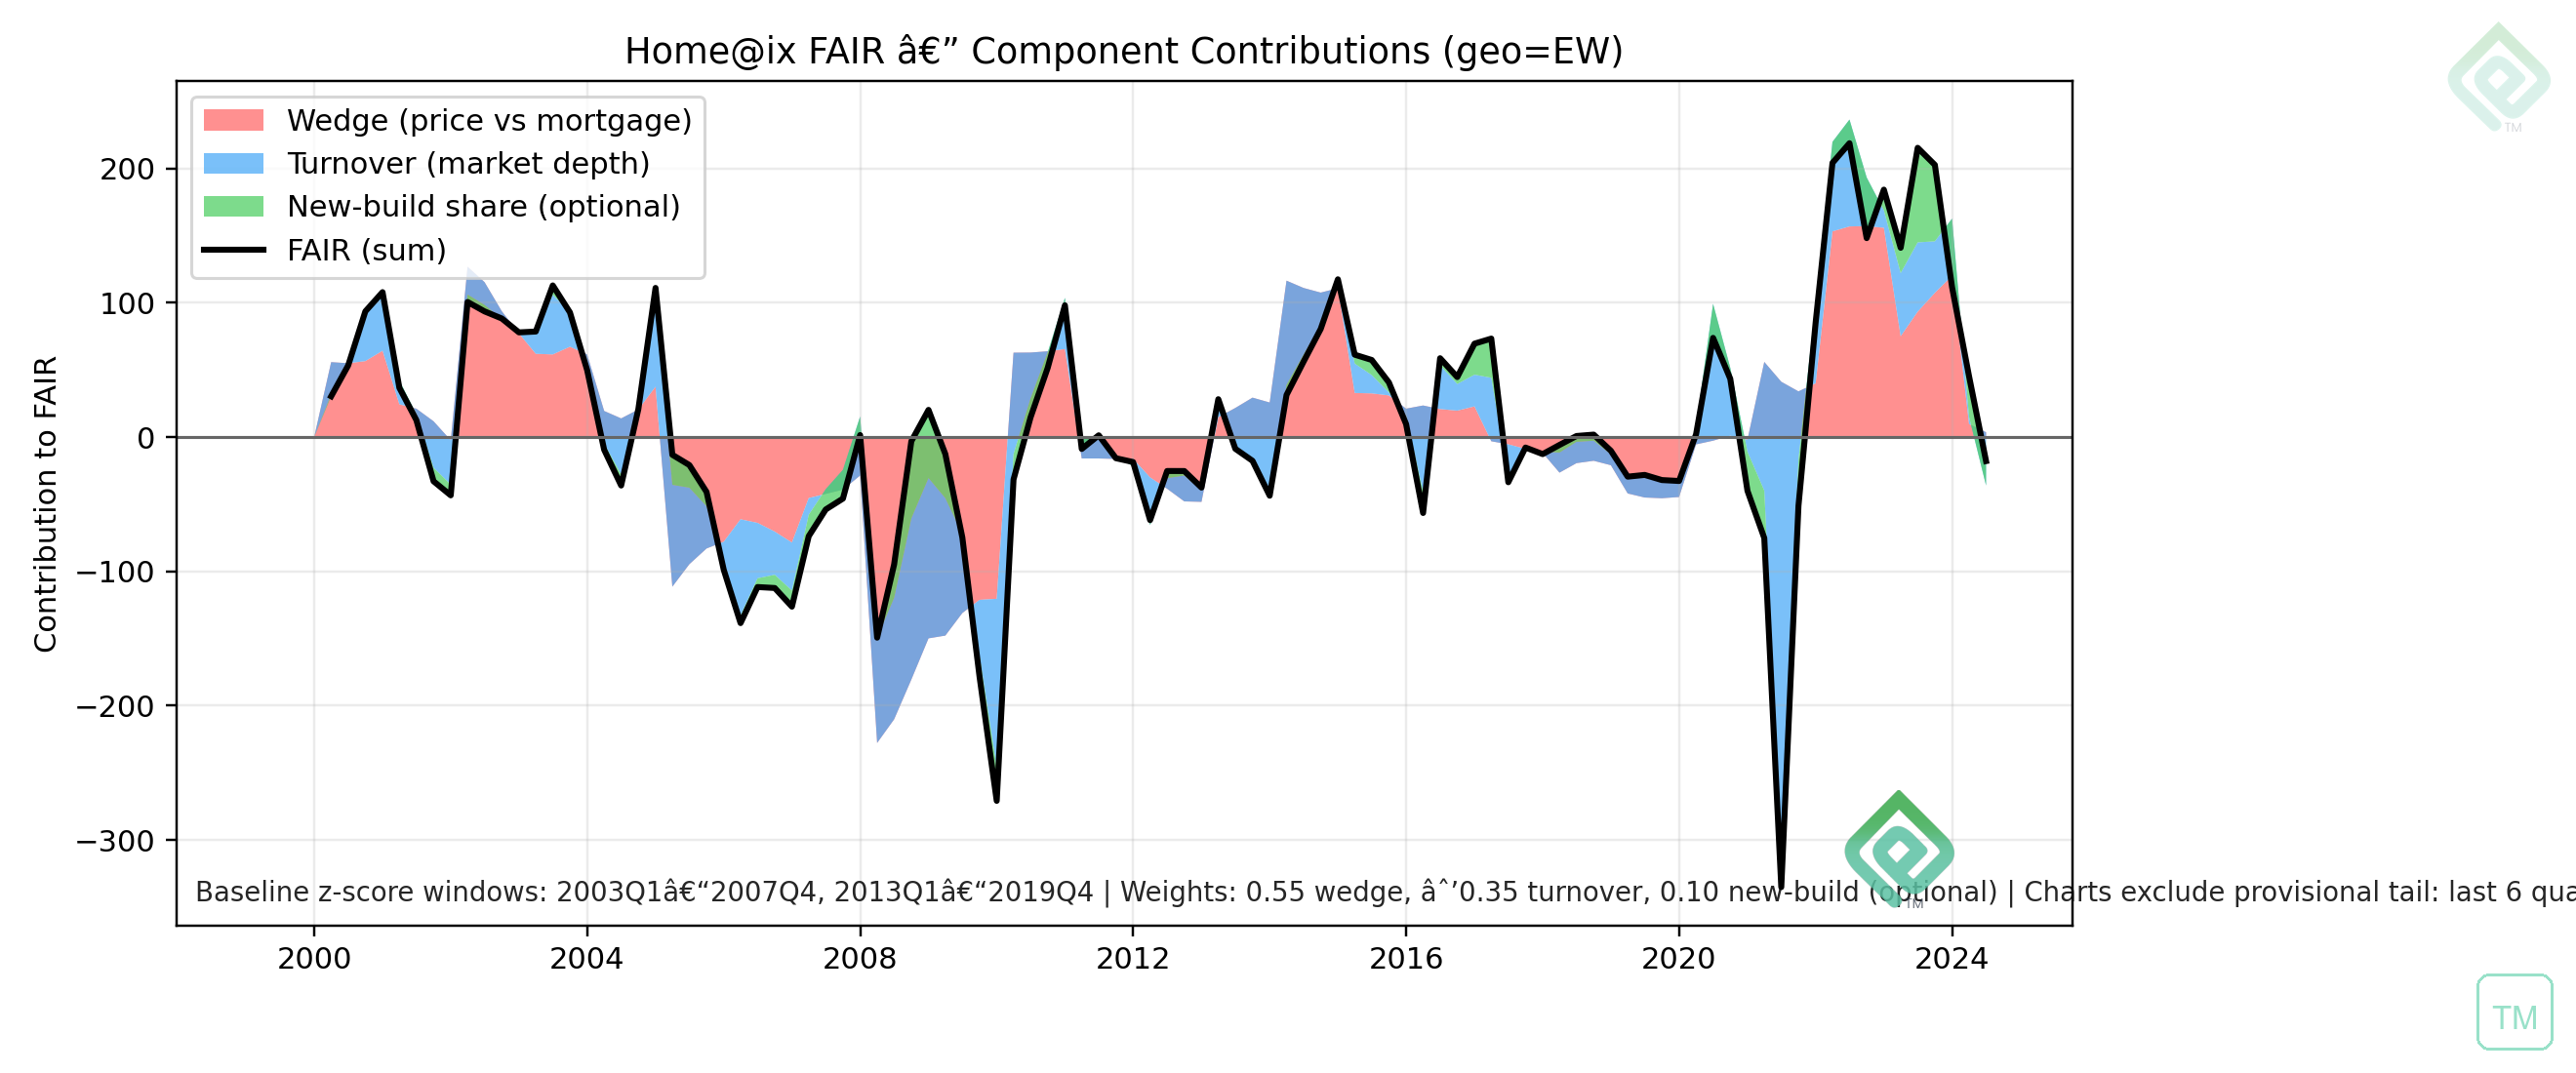
assets/figures/fig_fair_contrib.png
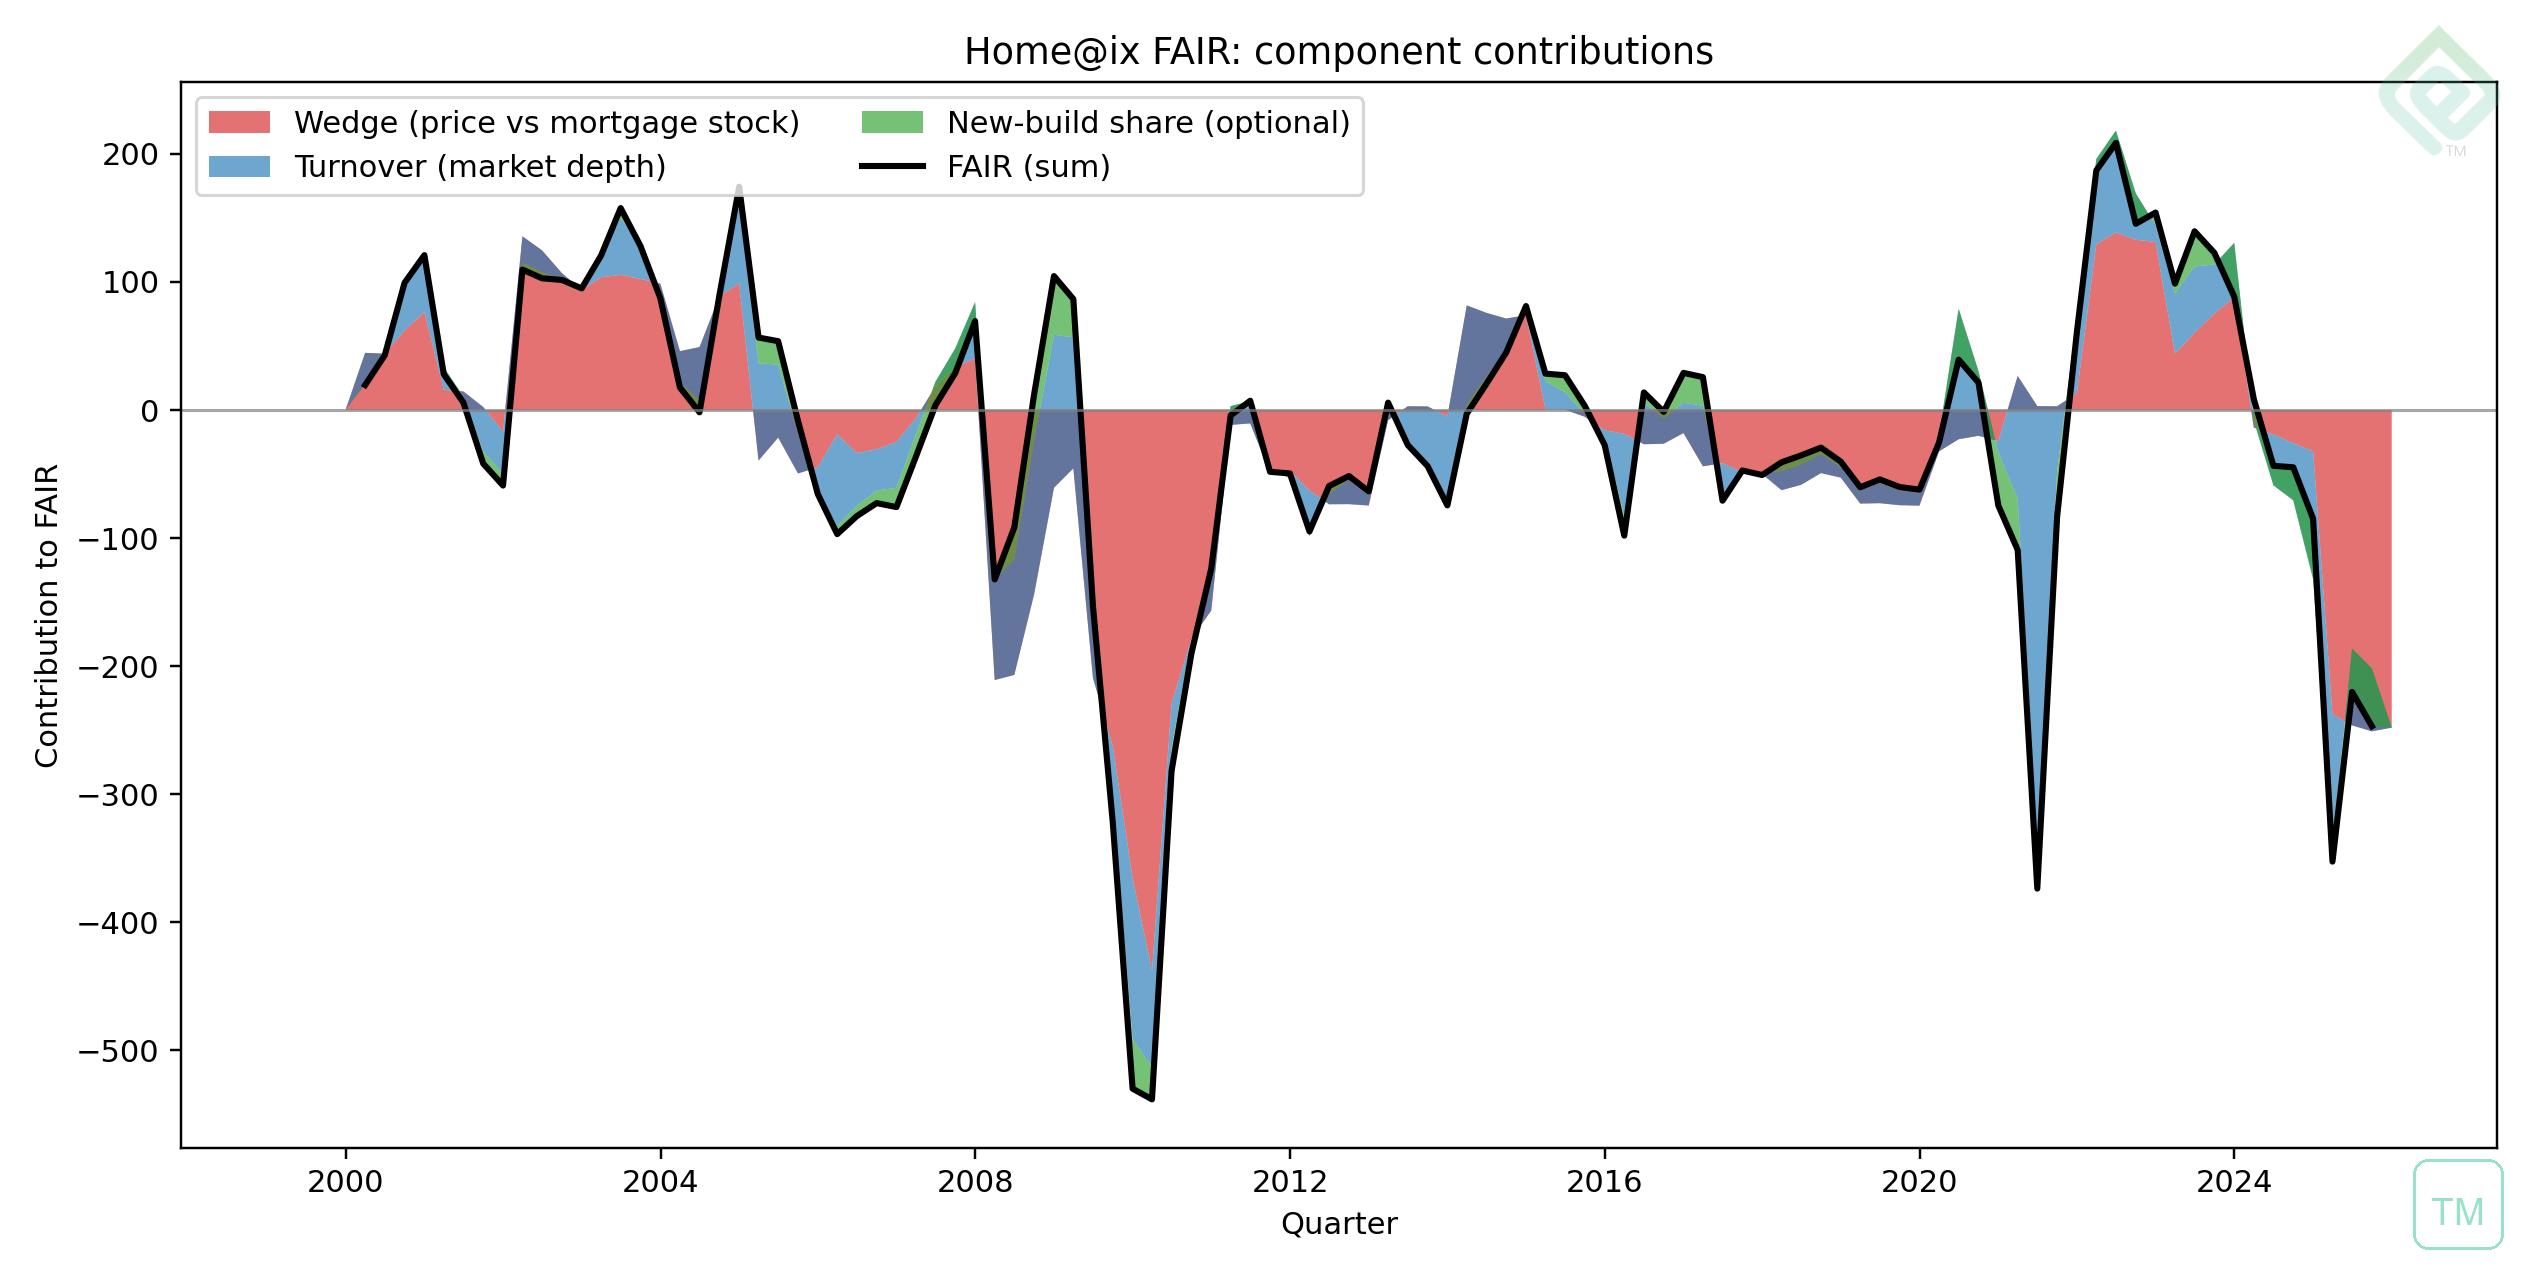
assets/fair_assets/fig_fair_contributions.png
9.3 Direction-of-flow (animated GIFs)
assets/figures/anim_fair_flow.gif
assets/fair_assets/anim_fair_direction_of_flow.gif
9.4 Backtest / evaluation figures

assets/draft_paper_assets/fig_price_and_fair_with_crisis_starts.png
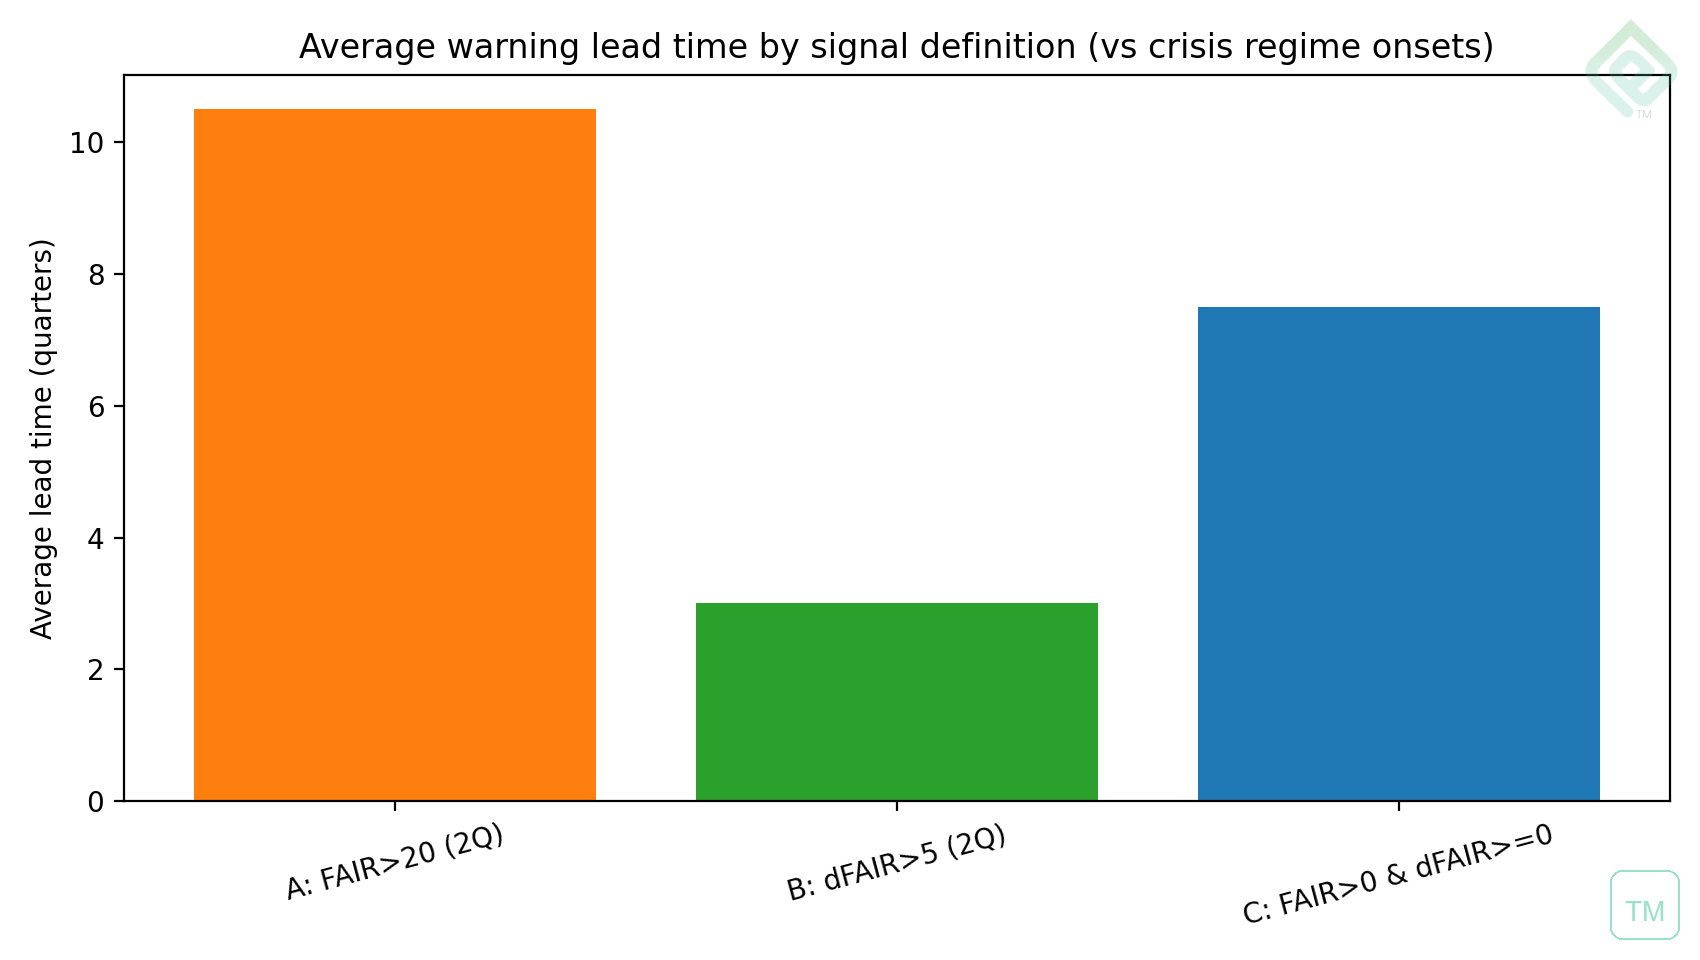
assets/draft_paper_assets/fig_avg_leadtime_by_signal.png
If any image fails to load, your Python server console will log a 404 showing the exact path requested.
10. Policy and Structural Reform (Implications of the Regime View)
Standard levers (rate cuts, planning reform, time-limited subsidies) can influence symptoms without breaking the feedback loops. If affordability deterioration is driven by allocation and throughput failure under mortgage-credit dominance, then structural reform must address credit channel design and tenure/ownership pathways.
| Problem loop | Symptom-focused lever | Structural lever (examples) |
|---|---|---|
| Mortgage-credit dominance ties stability to housing | Macroprudential tweaks, temporary guarantees | Ring-fenced affordable housing credit; alternative tenure finance |
| Thin-market clearing excludes mortgaged households | Stamp duty holidays, small buyer grants | Shared equity/co-op models; community land trusts |
| Developer pacing constrains near-term throughput | Planning speed, incentives to build | Counter-cyclical delivery vehicles; public options for build-to-live |
11. Limitations and Extensions
FAIR is intentionally reduced-form. It captures two dominant mechanisms but does not directly encode: arrears microdata, cash-buyer share, investor/renter distress transmission, or explicit developer pacing series. These are natural extensions that can be layered as satellite indicators.
12. Conclusion
UK housing affordability is not only a price level story; it is a regime story about who can transact and how the market clears when credit tightens. Mortgage-credit concentration links affordability outcomes to financial stability dynamics, and broad money conditions can amplify stress. Home@ix FAIR translates this diagnosis into an operational, reproducible monitor of regime risk by combining credit–price decoupling with market depth.
Reproducibility Note
Expected output directory contents (adjust to your workflow):
assets/fair_assets/fair_quarterly_audit.csvassets/figures/fig_fair_level.pngassets/figures/fig_fair_contrib.pngassets/figures/anim_fair_flow.gifassets/fair_assets/fig_fair_level.pngassets/fair_assets/fig_fair_contributions.pngassets/fair_assets/anim_fair_direction_of_flow.gifassets/draft_paper_assets/fig_price_and_fair_with_crisis_starts.pngassets/draft_paper_assets/fig_avg_leadtime_by_signal.png
FAIR — Professional summary (LinkedIn-style)
Thesis: The UK housing crisis isn't only about prices. In stressed regimes, markets can "clear" through exclusion, not repricing.
When turnover collapses and mortgage-dependent households are screened out, the reported price index becomes a selected statistic generated by a thinner, wealthier transacting set.
The coupled system (four loops)
- Bank credit quality and mortgage concentration
- Mortgage lending and broad money dynamics (deposit creation / M4 channel)
- Supply delivery constraints and developer pacing within absorption bands
- Affordability understood as access-and-allocation, not only burden ratios
Why "low arrears" can be a false comfort
Headline arrears can look stable even as vulnerability rises, because the observed borrower pool can improve via compositional selection (marginal cohorts stop transacting or are screened out of new lending). Buy-to-let arrears can behave as a leading indicator when landlord cashflows tighten.
Introducing FAIR (a forward regime signal)
FAIR is a quarterly indicator designed as a 2–3 year forward regime signal for affordability as access/allocation. It combines:
- Credit–price decoupling (a credit–price wedge)
- Market depth (turnover dynamics relative to stock)
- Optional: new-build share dynamics as a composition proxy
Transparent form (as used in this project):
$$FAIR = 100 \times (0.55 \times \text{credit–price wedge} - 0.35 \times \text{turnover growth} + 0.10 \times \Delta\text{new-build share})$$
Interpretation bands
| FAIR level | Regime signal |
|---|---|
| ≥ 50 | Strong deterioration risk |
| 20 to 50 | Mild deterioration bias |
| −20 to 20 | Neutral / noisy |
| −50 to −20 | Mild improvement bias |
| < −50 | Strong improvement (often stress-driven) |
Policy implication (what gets missed)
| Problem loop | Symptom lever | Structural lever |
|---|---|---|
| Mortgage-credit dominance ties stability to housing | Macroprudential tweaks, temporary guarantees | Ring-fenced affordable housing credit; alternative tenure finance |
| Thin-market clearing excludes mortgaged households | Buyer grants, transaction stimulus | Shared equity, co-op models, community land trusts |
| Developer pacing constrains near-term throughput | Planning speed incentives | Counter-cyclical delivery vehicles; public build-to-live options |
Bridge: The FAIR paper that follows formalises the measurement, definitions, and reproducible build for this indicator.
Home@ix FAIR — The Maths Explained
This paper builds a forward-looking affordability regime indicator (FAIR) for UK housing. The maths is deliberately simple — it's accounting identities and z-score composites, not econometric estimation.
1. The Supply & Need Identities
Identity 1: Affordable Market Supply (AMS)
$$AMS = (HM \cdot P \cdot AR \cdot D \cdot T \cdot PVC) + HS$$
| Term | Meaning |
|---|---|
| $$HM$$ | Housebuilding market capacity |
| $$P$$ | Affordable proportion of delivery |
| $$AR$$ | Absorption rate |
| $$D$$ | Diversity of tenure/product mix |
| $$T$$ | Throughput efficiency |
| $$PVC$$ | Planning value capture |
| $$HS$$ | Existing affordable housing stock (additive) |
Identity 2: Affordable Housing Need (AN)
$$AN = HD + (HM \cdot P \cdot AR \cdot D \cdot T \cdot PVC \cdot F) + HS - AMS + NCC$$
Substituting AMS and simplifying:
$$AN = HD + (HM \cdot P \cdot AR \cdot D \cdot T \cdot PVC \cdot (F - 1)) + NCC$$
- $$HD$$ = HomeMaker effective demand
- $$F$$ = sequencing/fast-tracking factor (baseline $$F=1$$)
- $$NCC$$ = New Circuit of Credit Creation
2. FAIR — The Indicator
Step 1: Year-on-Year Growth Rates
$$g_t^P = \frac{P_t - P_{t-4}}{P_{t-4}}$$
$$g_t^{MB} = \frac{MB_t - MB_{t-4}}{MB_{t-4}}$$
$$g_t^{TO} = \frac{TO_t - TO_{t-4}}{TO_{t-4}}$$
Step 2: Credit–Price Wedge
$$W_t = g_t^P - g_t^{MB}$$
Step 3: New-Build Share Change
$$\Delta NB_t = NB_t - NB_{t-4}$$
Step 4: Z-Score Normalisation
Baseline windows: 2003Q1–2007Q4 and 2013Q1–2019Q4.
$$z(X_t) = \frac{X_t - \mu_X}{\sigma_X}$$
Step 5: FAIR Composite
Three-component:
$$FAIR_t = 100 \cdot \Big( 0.55 \cdot z(W_t) - 0.35 \cdot z(g_t^{TO}) + 0.10 \cdot z(\Delta NB_t) \Big)$$
Two-component fallback:
$$FAIR_t = 100 \cdot \Big( 0.55 \cdot z(W_t) - 0.35 \cdot z(g_t^{TO}) \Big)$$
Step 6: Direction-of-Flow
$$\Delta FAIR_t = FAIR_t - FAIR_{t-1}$$
3. Interpretation Bands
| FAIR range | Regime reading |
|---|---|
| $$FAIR \ge 50$$ | Strong deterioration risk |
| $$20 \le FAIR < 50$$ | Mild deterioration bias |
| $$-20 \le FAIR < 20$$ | Neutral / noisy |
| $$-50 \le FAIR < -20$$ | Mild improvement bias |
| $$FAIR < -50$$ | Strong improvement (often stress-driven) |
4. Backtesting Framework
Warning Rules
| Rule | Condition | What it captures |
|---|---|---|
| A | $$FAIR > 20$$ for 2 consecutive quarters | Sustained elevated stress |
| B | $$\Delta FAIR > 5$$ for 2 consecutive quarters | Sustained acceleration |
| C | $$FAIR > 0$$ and $$\Delta FAIR \ge 0$$ | Broad worsening |
FAIR Paper
Home@ix FAIR: A Forward Indicator of UK Housing Affordability Regimes Using Credit–Price Decoupling and Market Depth
Abstract
UK housing affordability is usually discussed as a price level or a price-to-income ratio. That framing is necessary but incomplete because UK housing markets often do not clear primarily through price adjustment. In stressed regimes, markets clear through quantities and composition: turnover collapses, chains fail, mortgage-dependent households are rationed out, and observed prices can appear sticky or misleading. This paper introduces Home@ix FAIR: a quarterly indicator designed as a 2–3 year forward regime signal for affordability understood as access and allocation, not only price burden. FAIR is intentionally reduced-form and reproducible. It integrates a credit–price wedge (prices outrunning mortgage-stock growth), a market-depth term (turnover dynamics) capturing thin-market clearing, and an optional composition term (new-build share dynamics). To avoid defining “normal” using crisis regimes and structural breaks, FAIR is normalised to pooled baseline windows excluding the Global Financial Crisis aftermath and Covid-era disruptions. FAIR is paired with a direction-of-flow statistic and can be evaluated via event-based backtesting (drawdown-defined crash starts). Together, the index and backtests form an operational toolkit for monitoring affordability regime risk.
Executive Summary
UK housing affordability is typically treated as a static burden ratio. Yet housing is not a frictionless market. When credit tightens or uncertainty rises, the UK housing market frequently clears via reduced participation rather than orderly repricing: transactions fall, turnover collapses, and access deteriorates even when price ratios appear stable.
This paper introduces Home@ix FAIR, a reproducible quarterly indicator designed to act as a 2–3 year forward regime signal for affordability understood as access and allocation. FAIR integrates:
- a credit–price wedge capturing decoupling between house-price growth and mortgage-stock growth;
- a market-depth / turnover term capturing thin-market (quantity-clearing) stress; and
- an optional composition term based on new-build share dynamics.
To avoid contaminating baseline moments with crisis regimes and structural breaks, FAIR is normalised using pooled baseline windows:
- Baseline windows: 2003Q1–2007Q4 and 2013Q1–2019Q4
- Excluded: 2008–2012 (GFC and aftermath) and 2020+ (Covid and subsequent regime breaks)
FAIR is accompanied by a direction-of-flow measure and can be assessed as an early-warning tool using objective event definitions (e.g., crash starts defined by drawdowns from local peaks).
Introduction: Affordability as Access, Allocation, and Market Clearing
Standard affordability measures (e.g., price-to-income ratios) treat affordability as a price-only object. But UK housing often fails to clear under stress through price adjustment. Instead, the system shifts toward thin-market clearing:
- transactions decline sharply;
- the transacting population becomes more selected (composition shifts);
- access deteriorates even if headline price ratios appear stable.
This paper therefore treats affordability as a regime outcome shaped by credit creation, market depth, and institutional constraints, and introduces an indicator designed to detect when the system is moving into a regime where affordability is likely to deteriorate over the next 2–3 years.
From Descriptive Diagnosis to a Forward-Looking Tool
Home@ix begins from an integrated diagnosis: mortgage-credit dominance in bank balance sheets, endogenous money creation via bank lending, and housing’s role as both a necessity and collateral asset. Moving from diagnosis to a forward-looking tool requires operationalising how stressed regimes appear in observable data.
Why “forward-looking” is operationally meaningful here
A forward-looking affordability signal must capture two patterns that commonly precede later deterioration:
- Credit–price decoupling: price growth outruns mortgage-stock growth.
- Thin-market clearing: market depth collapses (turnover declines), indicating rationing and throughput failure.
FAIR integrates these mechanisms into a single auditable index with an explicit baseline definition.
Data and Reproducible Construction
FAIR is computed from quarterly series produced by the Home@ix feature set.
Inputs (quarterly)
Key variables:
- House prices (level):
avg_house_price_gbp - Mortgage stock (level, £m):
mb_total_gbp_m - Turnover (market depth):
turnover_pct_q(transactions scaled by dwelling stock) - Optional composition proxy:
newbuild_share_of_transactions - Time index:
period(quarter), andgeofor region selection (e.g., EW)
Derived series
Define year-on-year (YoY) growth rates:
Define the credit–price wedge:
Optional new-build share change (YoY):
Baseline Normalisation (Core Proviso)
To avoid defining “normal” using crisis regimes and structural breaks, z-scores are computed from pooled baseline windows:
- 2003Q1–2007Q4
- 2013Q1–2019Q4
Exclusions:
- 2008–2012 (Global Financial Crisis and aftermath)
- 2020+ (Covid and subsequent regime breaks)
For any series \(X_t\), define:
where $$\mu_X$$ and $$\sigma_X$$ are computed using baseline quarters only.
The Home@ix FAIR Indicator
FAIR definition
Default (three-component) specification:
If the new-build term is not available, the final term is omitted:
Direction-of-flow
Define the direction-of-flow statistic:
This is used for monitoring whether affordability pressure is accelerating or easing.
Interpretation bands (practical)
A simple interpretive scheme:
- $$FAIR \ge 50$$: strong deterioration regime risk
- $$20 \le FAIR < 50$$: mild deterioration bias
- $$-20 \le FAIR < 20$$: neutral/noisy
- $$-50 \le FAIR < -20$$: mild improvement bias
- $$FAIR < -50$$: strong improvement regime (often stress-driven)
Using FAIR for Forward-Looking Evaluation (Event Backtesting)
FAIR can be evaluated using objective events and simple warning rules.
Crash-start events (rule-based)
A “crash start” may be defined as a local price peak followed by a drawdown of at least $$X\%$$ within $$Y$$ quarters, with a minimum separation (cooldown) of $$C$$ quarters to avoid double-counting clustered peaks.
Illustrative warning rules
Examples:
- A: sustained level stress: $$FAIR > 20$$ for 2 quarters
- B: sustained acceleration: $$\Delta FAIR > 5$$ for 2 quarters
- C: broad stress-worsening: $$FAIR > 0$$ and $$\Delta FAIR \ge 0$$
Metrics
- Lead time (quarters) from the most recent signal to each crash start.
- False-positive proxy: share of signal quarters not followed by any crash start within a forward window (e.g., 8 quarters).
Outputs and Visualisations (Reproducible)
The FAIR build produces:
- a FAIR level figure (headline chart),
- a component contributions figure (mechanism chart),
- an animated direction-of-flow GIF emphasising $$\Delta FAIR_t$$,
- and a tidy CSV export of intermediate series for auditability.
Figure placeholders
Replace the filenames with the paths to the generated assets.
Limitations and Extensions
FAIR is a reduced-form indicator derived from aggregate market series. It does not directly encode distributional constraints (income heterogeneity, cash-buyer share, arrears microdata) or direct developer pacing series (e.g., sales per outlet per week) unless explicitly added. These are natural extensions; the baseline FAIR specification is intentionally reproducible and captures two dominant UK mechanisms: credit–price decoupling and thin-market clearing.
Conclusion
UK housing affordability is not only a price level problem; it is also an allocation and throughput problem. Home@ix FAIR provides a transparent, reproducible way to detect when the system is shifting into a regime where affordability is likely to deteriorate over a 2–3 year horizon via credit–price decoupling and/or collapsing market depth. Combined with direction-of-flow and event backtesting, FAIR is positioned as an operational forward-looking tool: a single “Number” grounded in auditable data and interpretable mechanisms.
Reproducibility Note
The figures referenced in Section 8 are produced by the FAIR build scripts in the Home@ix workflow. The output directory should contain:
fair_quarterly_audit.csvfig_fair_level.pngfig_fair_contributions.pnganim_fair_direction_of_flow.gif